Acer 2009 Annual Report Download - page 22
Download and view the complete annual report
Please find page 22 of the 2009 Acer annual report below. You can navigate through the pages in the report by either clicking on the pages listed below, or by using the keyword search tool below to find specific information within the annual report.-
 1
1 -
2
-
3
-
4
-
5
-
6
-
7
-
8
-
9
-
10
-
11
-
 12
12 -
 13
13 -
 14
14 -
 15
15 -
 16
16 -
 17
17 -
 18
18 -
 19
19 -
 20
20 -
 21
21 -
 22
22 -
 23
23 -
 24
24 -
 25
25 -
 26
26 -
 27
27 -
 28
28 -
 29
29 -
 30
30 -
 31
31 -
 32
32 -
33
-
34
-
35
-
36
-
37
-
38
-
39
-
40
-
41
-
42
-
43
-
44
-
45
-
46
-
47
-
48
-
49
-
50
-
51
-
52
-
53
-
54
-
55
-
56
-
57
-
58
-
59
-
60
-
61
-
62
-
63
-
64
-
65
 |
 |

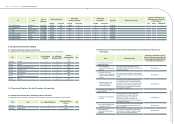
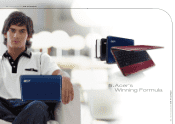
5.1 Acer’s Winning Formula
Acer dedicates its resources toward research and development, marketing, sales and after-services of IT and
communications devices. Today, our product offering includes notebooks, desktop PCs, LCD monitors, projectors,
servers and smartphones. In 2009, our consolidated revenue was NT$573.98B (US$17.9B) and operating income
reached NT$15.34B (US$479M). In the same year, Acer captured the No. 2 position for Total PCs and notebooks
worldwide.
Over the past few years, Acer has demonstrated a strong growing momentum in global PC shipments. According to
2009 PC shipment data by Gartner Dataquest, Acer maintained steady annual growth with 28.9% despite the worldwide
nancial downturn, far surpassing the top PC players and securing its position as the world’s No. 2 total PC vendor.
The successful mergers of Gateway (2007) and Packard Bell (2008) together completed Acer’s global footprint by
strengthening our presence in the U.S. and allowing a deeper penetration into the European and Asian markets.
These acquisitions also marked the beginning of a new era for Acer with a multi-brand strategy that targets different
geographic- and consumer segments. The Acer Group umbrella now consists of four brands – Acer, Gateway, Packard
Bell and eMachines.
In 2008 Acer entered the smartphone market, a decision that reects our expectation of the accelerating convergence
between PC and handheld communication devices in the coming years. Through the convergence of the 4Cs, a new
ICT industry is emerging and will present new opportunities in the form of products and services.
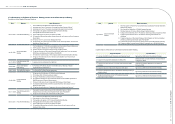
5.2 Keys to a Sustainable Future
5.2.1 Multi-brand Strategy
The PC is becoming a commodity. Acer is aware of the vast diversity among consumer tastes, that a single brand
cannot cover the preferences of all market segments. Acer saw the opportunity for a multi-brand strategy by acquiring
Gateway and Packard Bell. After extensive research and planning, Acer created a global multi-brand management
framework, which has become an essential pillar of our success forward.
5.2.2 Sustainable and Protable Business Model
Acer adheres to a channel business model that involves collaboration with first-class suppliers and distributors,
leveraging their resources and ultimately, sharing the fruits of success among all partners. Besides, our low capital- and
operating expense policy has been benecial to the steady growth of our business operations.
5.2.3 Efcient and Competitive Global Operations
Based upon the management philosophy of upholding a “simple” and “focused” approach, Acer is focused on building
its brand name business, developing mainstream products and maintaining competitive operating costs. In addition,
Acer has a exible and dynamic global logistics network to ensure our products’ time-to-market.
5.2.4 Fast Response and Decision Making
With a solid, global management force and efcient internal communication, Acer has the advantage of being able to
make key decisions within a short timeframe. Precise, follow-up implementation enables us to capture and gain from
business opportunities as they arise.
5.2.5 Customer-centric End-to-End Marketing Strengths
To begin with, our products are designed around customer needs – that means listening to and understanding exactly
what our customers want, and using our knowledge and skills to exceed their expectations by making technology simple
to use, stylish to own and accessible to everyone. Combined with Acer’s fast decision making, call to action and timely
release of products to market, form an end-to-end marketing prowess that ensures continuing business success ahead.
5.2.6 Growth and Scale
The recent mergers and combined scales have already created new synergies as predicted. With remarkable growths
in revenue, operating income and market share worldwide, Acer is today more competitive than ever.
Appendix
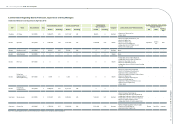
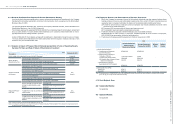
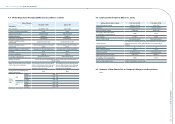
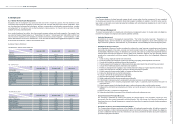
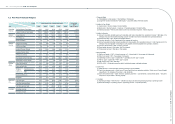
1. Key Buyers and Suppliers Accounting Over 10% of Total Net Sales and Purchase:
(1) Key Buyers for Acer Inc. (Parent Company)
Unit: NT$ Thousand
Item
Year 2008 Year 2009 Current year as of Mar. 31, 2010
From Amount
Percentage
of total net
sales (%)
Relationship
with
Acer Inc.
From Amount
Percentage
of total net
sales (%)
Relationship
with
Acer Inc.
From Amount
Percentage
of total net
sales (%)
Relationship
with
Acer Inc.
1 AEG 175,166,900 41.81 (Note 1) AEG 194,250,207 39.98 (Note 1) AEG 52,544,586 37.57 (Note 1)
2 AAC 77,740,860 18.56 (Note 1) AAC 130,941,632 26.95 (Note 1) AAC 34,788,672 24.88 (Note 1)
3 AAPH 39,997,623 9.55 (Note 1) AAPH 60,788,774 12.51 (Note 1) AAPH 20,956,084 14.98 (Note 1)
Note 1: Subsidiary of the Company.
(2) Key Suppliers for Acer Inc. (Parent Company)
Unit: NT$ Thousand
Item
Year 2008 Year 2009 Current year as of Mar. 31, 2010
From Amount
Percentage
of total net
purchase
(%)
Relationship
with
Acer Inc.
From Amount
Percentage
of total net
purchase
(%)
Relationship
with
Acer Inc.
From Amount
Percentage
of total net
purchase
(%)
Relationship
with
Acer Inc.
1 Supplier A 132,799,596 20.53 none Supplier A 177,956,728 23.36 none Supplier A 64,719,557 29.24 none
2 Supplier B 80,334,992 12.42 none Supplier B 83,823,914 11.00 none
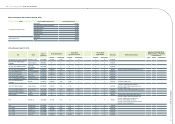
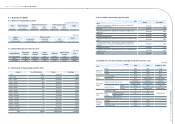
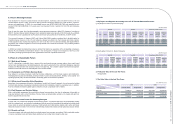
2. Production Value in the Last Two Years:
Not applicable.
3. The Sales Value in the Last Two Years:
Unit: NT$ Thousand
Year
Major production
2008 2009
Domestic Sales Foreign Sales Domestic Sales Foreign Sales
Computer 12,048,647 330,534,725 13,414,825 392,305,898
Peripherals & Others 65,184,369 11,171,274 58,265,156 21,937,100
Total 77,233,016 341,705,999 71,679,981 414,242,998
Acer Incorporated 2009 Annual Report
38.
Acer Incorporated 2009 Annual Report
39. Acer’s Winning Formula