Acer 2009 Annual Report Download - page 43
Download and view the complete annual report
Please find page 43 of the 2009 Acer annual report below. You can navigate through the pages in the report by either clicking on the pages listed below, or by using the keyword search tool below to find specific information within the annual report.-
 1
1 -
2
-
3
-
4
-
5
-
6
-
7
-
8
-
9
-
10
-
11
-
12
-
13
-
14
-
15
-
16
-
17
-
18
-
19
-
20
-
21
-
22
-
23
-
24
-
25
-
26
-
27
-
28
-
29
-
30
-
31
-
32
-
 33
33 -
 34
34 -
 35
35 -
 36
36 -
 37
37 -
 38
38 -
 39
39 -
 40
40 -
 41
41 -
 42
42 -
 43
43 -
 44
44 -
 45
45 -
 46
46 -
 47
47 -
 48
48 -
 49
49 -
 50
50 -
 51
51 -
 52
52 -
 53
53 -
54
-
55
-
56
-
57
-
58
-
59
-
60
-
61
-
62
-
63
-
64
-
65
 |
 |

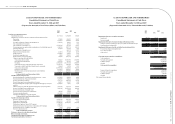
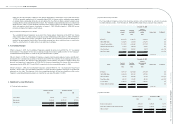
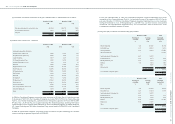
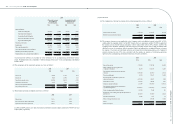
(4) Available-for-sale nancial assets ‒ current
December 31, 2008 December 31, 2009
NT$ NT$ US$
Publicly traded equity securities 145,147 223,437 6,976
Money market funds and others 446,297 - -
591,444 223,437 6,976
In 2008 and 2009, the Consolidated Companies disposed of portions of these investments and recognized gains
on disposal thereof of NT$1,187,156 and NT$24,022, respectively. The gains were recorded as “gain on disposal
of investments” in the accompanying consolidated statements of income.
(5) Financial assets and liabilities at fair value through prot or loss ‒ current
December 31, 2008 December 31, 2009
NT$ NT$ US$
Financial assets at fair value through prot or loss ‒ current:
Foreign currency forward contracts 339,817 139,515 4,356
Foreign exchange swaps 7,113 - -
Cross currency swaps 7,821 - -
Foreign currency options - 18,144 566
354,751 157,659 4,922
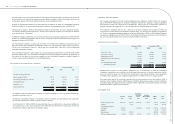
December 31, 2008 December 31, 2009
NT$ NT$ US$
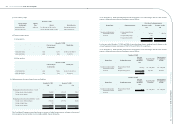
Financial liability at fair value through prot or loss ‒ current:
Foreign currency forward contracts (1,011,739) (157,848) (4,928)
Foreign currency options - (4,691) (147)
(1,011,739) (162,539) (5,075)
For the years ended December 31, 2008 and 2009, unrealized gins (losses) resulting from the changes in fair
value of these derivative contracts amounted to NT$718,172 and NT$652,108, respectively.
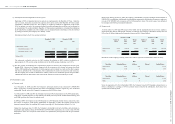
The Consolidated Companies entered into derivative contracts to manage foreign currency exchange risk resulting
from operating activities. As of December 31, 2008 and 2009, the derivative nancial instruments that did not
conform to the criteria for hedge accounting and were classied as nancial assets and liabilities at fair value
through prot or loss consisted of the following:
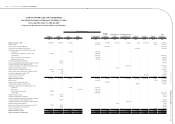
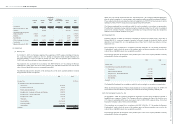
(a) Foreign currency forward contracts
December 31,2008
Buy Sell
Contract amount
(in thousand) Maturity date
USD / SGD USD 7,000 2009/01/14~2009/02/26
USD / CAD USD 47,806 2009/01/28~2009/02/26
EUR /CHF EUR 19,000 2009/01/05~2009/03/30
USD / EUR EUR 720,000 2009/01/15~2009/02/27
USD / INR USD 61,600 2009/01/06~2009/05/29
USD / MYR USD 19,138 2009/01/14~2009/02/17
USD / PHP USD 500 2009/01/15
USD / THB USD 28,700 2009/01/14~2009/05/29
USD / RMB USD 70,000 2009/02/02~2009/03/30
USD / JPY USD 5,000 2009/01/14
USD / NTD USD 5,000 2009/01/09~2009/01/22
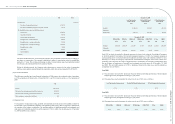
December 31,2009
Buy Sell
Contract amount
(in thousand) Maturity date
USD / SGD USD 12,600 2010/01/19~2010/03/15
USD / MXN USD 96,100 2010/01/15~2010/03/26
USD / EUR EUR 47,000 2010/02/26
USD / INR USD 55,992 2010/01/15~2010/03/31
USD / MYR USD 15,400 2010/01/19~2010/03/31
USD / THB USD 20,670 2010/01/15~2010/02/19
USD / JPY USD 68,300 2010/01/15~2010/04/15
USD / RUB USD 124,000 2010/01/15~2010/04/15
USD / PHP USD 100 2010/01/08
USD / ZAR USD 21,500 2010/01/15~2010/03/31
USD / NTD USD 5,000 2010/01/11~2010/02/10
EUR /NOK EUR 17,403 2010/01/15~2010/04/15
EUR / SEK EUR 48,400 2010/01/15~2010/04/15
EUR /PLN EUR 23,000 2010/01/15
RUB / USD USD 36,689 2010/01/15
MXN / USD USD 2,900 2010/01/29
(b) Foreign exchange swaps
December 31, 2008
Contract amount (in thousands) Maturity date
Swap-in USD / Swap-out NTD USD 160,000 / NTD 5,243,200 2009/01/15
Acer Incorporated 2009 Annual Report
80.
Acer Incorporated 2009 Annual Report
81. Financial Standing