Acer 2009 Annual Report Download - page 35
Download and view the complete annual report
Please find page 35 of the 2009 Acer annual report below. You can navigate through the pages in the report by either clicking on the pages listed below, or by using the keyword search tool below to find specific information within the annual report.-
 1
1 -
2
-
3
-
4
-
5
-
6
-
7
-
8
-
9
-
10
-
11
-
12
-
13
-
14
-
15
-
16
-
17
-
18
-
19
-
20
-
21
-
22
-
23
-
24
-
 25
25 -
 26
26 -
 27
27 -
 28
28 -
 29
29 -
 30
30 -
 31
31 -
 32
32 -
 33
33 -
 34
34 -
 35
35 -
 36
36 -
 37
37 -
 38
38 -
 39
39 -
 40
40 -
 41
41 -
 42
42 -
 43
43 -
 44
44 -
 45
45 -
46
-
47
-
48
-
49
-
50
-
51
-
52
-
53
-
54
-
55
-
56
-
57
-
58
-
59
-
60
-
61
-
62
-
63
-
64
-
65
 |
 |

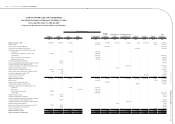
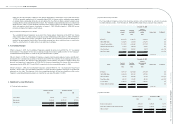
ACER INCORPORATED AND SUBSIDIARIES
Consolidated Statements of Cash Flows
Years ended December 31, 2008 and 2009
(Expressed in thousands of New Taiwan dollars and US dollars)
2008 2009
NT$ NT$ US$
Cash ows from operating activities:
Consolidated net income 11,737,124 11,352,860 354,445
Adjustments to reconcile net income to cash provided by operating activities:
Depreciation 955,880 846,303 26,422
Amortization 1,245,561 1,860,284 58,079
Loss (gain) on disposal of property and equipment, net (515,272) 103,055 3,217
Gain on liquidation of investments - (4,236) (132)
Gain on disposal of investments, net (2,709,524) (79,162) (2,471)
Net investment gain on equity method investments, net of cash dividends received (146,392) (320,773) (10,015)
Other investment loss 416,404 231,934 7,241
Gain on disposal of intangible assets - (46,037) (1,437)
Impairment of non-nancial assets 221,931 395,109 12,336
Restructuring cost 1,582,408 164,595 5,139
Stock-based compensation cost 37,856 298,592 9,322
Deferred income tax expense (benet) 786,086 (951,327) (29,701)
Changes in operating assets and liabilities:
Notes and accounts receivable 452,252 (4,032,056) (125,884)
Receivables from related parties (327,579) 241,158 7,529
Inventories (4,882,424) (11,173,624) (348,849)
Other nancial assets, prepayments and other current assets (2,070,311) (720,480) (22,494)
Noncurrent receivable (under other nancial assets ‒ noncurrent) 186,604 69,926 2,183
Notes and accounts payable (16,097,164) 31,466,106 982,395
Payables to related parties 2,447,835 2,384,367 74,442
Royalties payable, accrued expenses and other current liabilities 1,831,291 6,563,601 204,920
Other liabilities (319,014) (458,091) (14,302)
Cash provided by (used in) operating activities (5,166,448) 38,192,104 1,192,385
Cash ows from investing activities:
Proceeds from disposal of available-for-sale nancial assets ‒ current 2,891,868 480,068 14,988
Proceeds from disposal of long-term investments 3,449,388 562,612 17,565
Increase in long-term investments (171,717) (259,905) (8,114)
Proceeds from capital return and liquidation of investees 462,551 231,897 7,240
Proceeds from disposal of property, plant and equipment and property not used in
operation
2,068,099 75,067 2,343
Additions to property, plant and equipments and property not used in operation (597,526) (771,575) (24,089)
Increase in intangible assets and other assets (435,746) (3,077,879) (96,094)
Proceeds from disposal of intangible assets - 25,000 781
Decrease (increase) in advances to related parties (14,230) 23,666 739
Decrease in restricted deposits 1,813,448 922,794 28,810
Acquisition of subsidiaries, net of cash acquired (719,026) - -
Cash provided by (used in) investing activities 8,747,109 (1,788,255) (55,831)
Cash ows from nancing activities:
Decrease in short-term borrowings (4,285,258) (538,792) (16,821)
Repayment of long-term debt (4,423,321) (10,702) (334)
Distribution of cash dividends (8,544,934) (5,215,456) (162,830)
Distribution of employees’ bonus (2007 earnings) (544,728) - -
Distribution of directors’ and supervisors’ remuneration (2007 earnings) (116,630) - -
Proceeds from exercise of employee stock option 2,102 103,590 3,234
Decrease in minority interests (42,354) (63,768) (1,991)
Cash used in nancing activities (17,955,123) (5,725,128) (178,742)
Net increase (decrease) in cash and cash equivalents (14,374,462) 30,678,721 957,812
Effects of exchange rate changes (1,429,152) 795,621 24,840
Cash and cash equivalents at beginning of year 37,945,339 22,141,725 691,281
Cash and cash equivalents at end of year 22,141,725 53,616,067 1,673,933
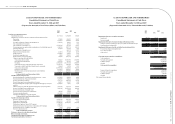
ACER INCORPORATED AND SUBSIDIARIES
Consolidated Statements of Cash Flows
Years ended December 31, 2008 and 2009
(Expressed in thousands of New Taiwan dollars and US dollars)
2008 2009
NT$ NT$ US$
Supplemental disclosures of cash ow information
Interest paid 1,275,330 444,067 13,864
Income taxes paid 1,977,802 3,196,014 99,782
Supplemental disclosures of non-cash investing and nancing activities:
Change in unrealized valuation gain (loss) on available-for-sale nancial assets 3,964,729 2,457,985 76,740
Current portion of long-term debt 8,250,000 - -
Supplemental disclosures of partial cash inow from investing activities:
Proceeds from disposal of intangible assets - 75,000 2,342
Less: other receivables - (50,000) (1,561)
Cash received - 25,000 781
Cash acquired from acquisition of subsidiaries.: Parkard Bell B.V.
Cash consideration 3,172,080
Non-cash assets acquired (10,560,058)
Liabilities assumed 10,704,787
Goodwill (1,774,172)
Cash acquired from acquisition 1,542,637
E-Ten Information
Systems Co., Ltd.
Issuance of shares for acquisitions 8,837,267
Non-cash assets acquired (7,288,921)
Liabilities assumed 1,263,892
Goodwill (1,901,821)
Cash acquired from acquisition 910,417
Acer Incorporated 2009 Annual Report
64.
Acer Incorporated 2009 Annual Report
65. Financial Standing