Acer 2009 Annual Report Download - page 45
Download and view the complete annual report
Please find page 45 of the 2009 Acer annual report below. You can navigate through the pages in the report by either clicking on the pages listed below, or by using the keyword search tool below to find specific information within the annual report.-
 1
1 -
2
-
3
-
4
-
5
-
6
-
7
-
8
-
9
-
10
-
11
-
12
-
13
-
14
-
15
-
16
-
17
-
18
-
19
-
20
-
21
-
22
-
23
-
24
-
25
-
26
-
27
-
28
-
29
-
30
-
31
-
32
-
33
-
34
-
 35
35 -
 36
36 -
 37
37 -
 38
38 -
 39
39 -
 40
40 -
 41
41 -
 42
42 -
 43
43 -
 44
44 -
 45
45 -
 46
46 -
 47
47 -
 48
48 -
 49
49 -
 50
50 -
 51
51 -
 52
52 -
 53
53 -
 54
54 -
 55
55 -
56
-
57
-
58
-
59
-
60
-
61
-
62
-
63
-
64
-
65
 |
 |

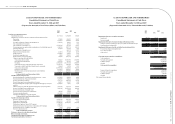
As of December 31, 2008 and 2009, unrealized gains (losses) on derivative financial instruments effective as
cash ow hedges, amounted to NT$(273,565) and NT$12,398, respectively, which were recognized in “hedging
reserve”, a separate component of stockholder’s equity.
Details of hedging derivative nancial instruments described above that were outstanding as of December 31,
2008 and 2009 were as follows:
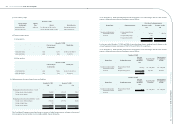
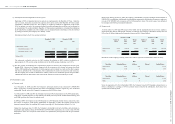
(a) Foreign currency forward contracts
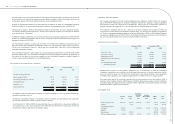
December 31, 2008
Buy Sell Contract amount (in thousands) Maturity date
USD / AUD USD 68,190 2009/01/30~2009/05/29
AUD / USD USD 11,867 2009/01/30~2009/04/30
USD / CAD USD 39,095 2009/02/26~2009/04/30
EUR / DKK EUR 94 2009/01/15
USD / EUR EUR 252,798 2009/01/30~2009/03/31
EUR /GBP EUR 165,369 2009/01/15~2009/02/27
EUR /NOK EUR 14,311 2009/01/13~2009/02/27
USD / NZD USD 4,500 2009/01/30~2009/05/29
EUR / SEK EUR 19,612 2009/01/13~2009/02/27
USD / JPY USD 70,000 2009/01/15~2009/05/29
USD / ZAR USD 17,300 2009/01/15~2009/03/31
USD / MXN USD 90,000 2009/01/09~2009/04/17
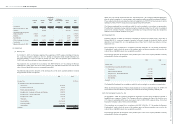
December 31, 2009
Buy Sell Contract amount (in thousands) Maturity date
USD / AUD USD 51,000 2010/01/29~2010/02/26
USD / CAD USD 58,265 2010/01/29~2010/02/25
USD / EUR EUR 870,918 2010/01/15~2010/03/16
EUR /GBP EUR 237,105 2010/01/15~2010/03/31
USD / NZD USD 3,900 2010/01/29~2010/03/31
AUD / NZD AUD 2,150 2010/01/29~2010/02/26
USD / RMB USD 160,000 2010/01/18~2010/04/29
USD / NTD USD 25,000 2010/01/19
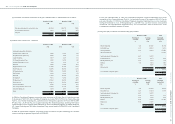
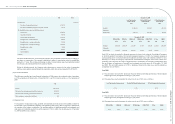
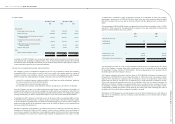
(b) Foreign currency options
(i) Long position
December 31, 2008
Contract amount (in thousands) Maturity date
USD Call/AUD Put USD 6,445 2009/01/28~2009/02/25
EUR Call/GBP Put EUR 43,257 2009/01/30~2009/03/31
USD Call/EUR Put USD 6,000 2009/01/30
NZD Call/USD Put USD 1,000 2009/01/28~2009/02/25
EUR Call/NOK Put EUR 4,200 2009/01/15
EUR Call/SEK Put EUR 3,900 2009/01/15
(ii) Short position
December 31, 2008
Contract amount (in thousands) Maturity date
AUD Call/USD Put USD 6,445 2009/01/28~2009/02/25
GBP Call/EUR Put EUR 55,984 2009/01/30~2009/03/31
EUR Call/USD Put USD 6,000 2009/01/30
USD Call/NZD Put USD 1,000 2009/01/28~2009/02/25
NOK Call/EUR Put EUR 4,200 2009/01/15
SEK Call/EUR Put EUR 5,850 2009/01/15
(c) Foreign exchange swap
December 31, 2008
Contract amount (in thousands) Maturity date
Swap-in SEK/Swap-out EUR SEK 17,000 /EUR 1,554 2009/01/15
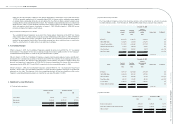
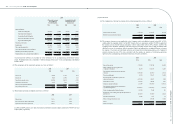
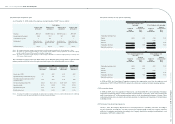
(7) Inventories
(a) Inventories (net of provision for obsolescence and slow-moving inventories) as of December 31, 2008 and
2009, were as follows:
December 31, 2008 December 31, 2009
NT$ NT$ US$
Raw materials 14,528,727 18,489,941 577,269
Work in process 49,437 45,089 1,408
Finished goods and merchandise 14,122,367 15,471,217 483,023
Spare parts 2,093,862 2,477,522 77,350
Inventories in transit 9,233,802 14,701,184 458,982
40,028,195 51,184,953 1,598,032
Acer Incorporated 2009 Annual Report
84.
Acer Incorporated 2009 Annual Report
85. Financial Standing