Supercuts 2007 Annual Report Download - page 72
Download and view the complete annual report
Please find page 72 of the 2007 Supercuts annual report below. You can navigate through the pages in the report by either clicking on the pages listed below, or by using the keyword search tool below to find specific information within the annual report.-
 1
1 -
2
-
3
-
4
-
5
-
6
-
7
-
8
-
9
-
10
-
11
-
12
-
13
-
14
-
15
-
16
-
17
-
18
-
19
-
20
-
21
-
22
-
23
-
24
-
25
-
26
-
27
-
28
-
29
-
30
-
31
-
32
-
33
-
34
-
35
-
36
-
37
-
38
-
39
-
40
-
41
-
42
-
43
-
44
-
45
-
46
-
47
-
48
-
49
-
50
-
51
-
52
-
53
-
54
-
55
-
56
-
57
-
58
-
59
-
60
-
61
-
 62
62 -
 63
63 -
 64
64 -
 65
65 -
 66
66 -
 67
67 -
 68
68 -
 69
69 -
 70
70 -
 71
71 -
 72
72 -
 73
73 -
 74
74 -
 75
75 -
 76
76 -
 77
77 -
 78
78 -
 79
79 -
 80
80 -
 81
81 -
 82
82 -
83
-
84
-
85
-
86
-
87
-
88
-
89
-
90
-
91
-
92
-
93
-
94
-
95
-
96
-
97
-
98
-
99
-
100
-
101
-
102
-
103
-
104
-
105
-
106
-
107
-
108
-
109
-
110
-
111
-
112
-
113
-
114
-
115
-
116
-
117
-
118
-
119
-
120
-
121
-
122
-
123
-
124
-
125
-
126
-
127
-
128
-
129
-
130
-
131
-
132
-
133
-
134
-
135
-
136
-
137
-
138
-
139
-
140
-
141
-
142
-
143
-
144
-
145
-
146
-
147
-
148
-
149
-
150
-
151
-
152
-
153
-
154
-
155
-
156
-
157
-
158
-
159
-
160
-
161
-
162
-
163
-
164
-
165
-
166
-
167
-
168
-
169
-
170
-
171
-
172
-
173
-
174
-
175
-
176
-
177
-
178
-
179
-
180
-
181
-
182
-
183
-
184
-
185
-
186
-
187
-
188
-
189
-
190
-
191
-
192
-
193
 |
 |

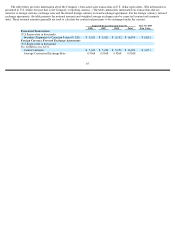
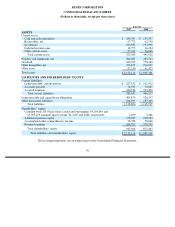
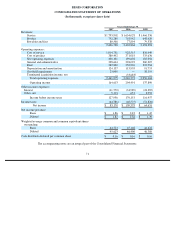
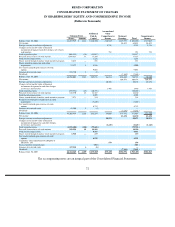
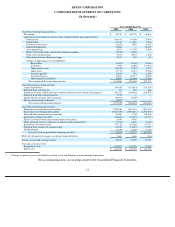
REGIS CORPORATION
CONSOLIDATED STATEMENT OF OPERATIONS
(In thousands, except per share data)
The accompanying notes are an integral part of the Consolidated Financial Statements.
71
Years Ended June 30,
2007
2006
2005
Revenues:
Service
$
1,793,802
$
1,634,028
$
1,466,336
Product
752,280
718,942
648,420
Royalties and fees
80,506
77,894
79,538
2,626,588
2,430,864
2,194,294
Operating expenses:
Cost of service
1,014,781
928,515
836,449
Cost of product
380,492
371,018
335,636
Site operating expenses
208,101
199,602
183,056
General and administrative
328,644
294,092
260,207
Rent
382,820
350,926
310,984
Depreciation and amortization
124,137
115,903
91,753
Goodwill impairment
23,000
—
38,319
Terminated acquisition income, net
—
(
33,683
)
—
Total operating expenses
2,461,975
2,226,373
2,056,404
Operating income
164,613
204,491
137,890
Other income (expense):
Interest
(41,770
)
(34,989
)
(24,385
)
Other, net
5,113
651
2,952
Income before income taxes
127,956
170,153
116,457
Income taxes
(44,786
)
(60,575
)
(51,826
)
Net income
$
83,170
$
109,578
$
64,631
Net income per share:
Basic
$
1.86
$
2.43
$
1.45
Diluted
$
1.82
$
2.36
$
1.39
Weighted average common and common equivalent shares
outstanding:
Basic
44,723
45,168
44,622
Diluted
45,623
46,400
46,380
Cash dividends declared per common share
$
0.16
$
0.16
$
0.16