Supercuts 2007 Annual Report Download - page 29
Download and view the complete annual report
Please find page 29 of the 2007 Supercuts annual report below. You can navigate through the pages in the report by either clicking on the pages listed below, or by using the keyword search tool below to find specific information within the annual report.-
 1
1 -
2
-
3
-
4
-
5
-
6
-
7
-
8
-
9
-
10
-
11
-
12
-
13
-
14
-
15
-
16
-
17
-
18
-
 19
19 -
 20
20 -
 21
21 -
 22
22 -
 23
23 -
 24
24 -
 25
25 -
 26
26 -
 27
27 -
 28
28 -
 29
29 -
 30
30 -
 31
31 -
 32
32 -
 33
33 -
 34
34 -
 35
35 -
 36
36 -
 37
37 -
 38
38 -
 39
39 -
40
-
41
-
42
-
43
-
44
-
45
-
46
-
47
-
48
-
49
-
50
-
51
-
52
-
53
-
54
-
55
-
56
-
57
-
58
-
59
-
60
-
61
-
62
-
63
-
64
-
65
-
66
-
67
-
68
-
69
-
70
-
71
-
72
-
73
-
74
-
75
-
76
-
77
-
78
-
79
-
80
-
81
-
82
-
83
-
84
-
85
-
86
-
87
-
88
-
89
-
90
-
91
-
92
-
93
-
94
-
95
-
96
-
97
-
98
-
99
-
100
-
101
-
102
-
103
-
104
-
105
-
106
-
107
-
108
-
109
-
110
-
111
-
112
-
113
-
114
-
115
-
116
-
117
-
118
-
119
-
120
-
121
-
122
-
123
-
124
-
125
-
126
-
127
-
128
-
129
-
130
-
131
-
132
-
133
-
134
-
135
-
136
-
137
-
138
-
139
-
140
-
141
-
142
-
143
-
144
-
145
-
146
-
147
-
148
-
149
-
150
-
151
-
152
-
153
-
154
-
155
-
156
-
157
-
158
-
159
-
160
-
161
-
162
-
163
-
164
-
165
-
166
-
167
-
168
-
169
-
170
-
171
-
172
-
173
-
174
-
175
-
176
-
177
-
178
-
179
-
180
-
181
-
182
-
183
-
184
-
185
-
186
-
187
-
188
-
189
-
190
-
191
-
192
-
193
 |
 |

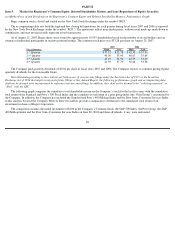
Repurchases of the Company’s common stock during the quarter ended June 30, 2007 were part of this repurchase program. These shares
are included within the total number of shares purchased and the average price paid per share in the table below, which shows the monthly,
fourth quarter fiscal year 2007 stock repurchase activity:
CEO and CFO Certifications
The certifications by our chief executive officer and chief financial officer required under Section 302 of the Sarbanes-Oxley Act of 2002,
have been filed as exhibits to this Annual Report on Form 10-K. Our CEO’s annual certification pursuant to NYSE Corporate Governance
Standards Section 303A.12(a) that our CEO was not aware of any violation by the company of the NYSE’s Corporate Governance listing
standards was submitted to the NYSE on November 16, 2006.
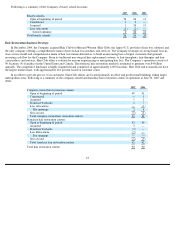
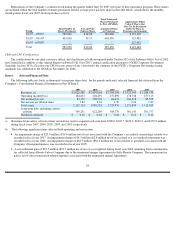
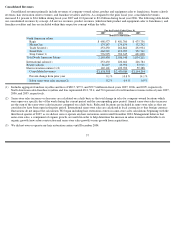
Item 6.
Selected Financial Data
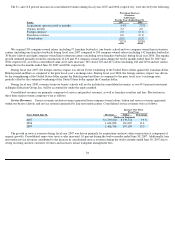
The following table sets forth, in thousands (except per share data), for the periods indicated, selected financial data derived from the
Company’s Consolidated Financial Statements in Part II, Item 8.
a)
Revenues from salons, schools or hair restorations centers acquired each year were $108.0, $165.7, $181.2, $122.3, and $152.9 million
during fiscal years 2007, 2006, 2005, 2004, and 2003, respectively.
b)
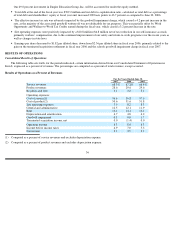
The following significant items affected both operating and net income:
•
An impairment charge of $23.0 million ($19.6 million net of tax) associated with the Company’s accredited cosmetology schools was
recorded in fiscal year 2007. An impairment charge of $4.3 million ($2.8 million net of tax) related to a cost method investment was
recorded in fiscal year 2006. An impairment charge of $38.3 million ($38.3 million net of tax) related to goodwill associated with the
Company’s European business was recorded in fiscal year 2005.
•
A net settlement gain of $33.7 million ($21.7 million net of tax) was recognized during fiscal year 2006 stemming from a termination
fee collected from Alberto-Culver Company due to the terminated merger Agreement for Sally Beauty Company. The termination fee
gain is net of direct transaction-related expenses associated with the terminated merger Agreement.
28
Period
Total Number of
Shares Purchased
Average Price
Paid per Share
Total Number of
Shares Purchased
As Part of Publicly
Announced Plans
or Programs
Approximate Dollar
Value of Shares that
May Yet Be Purchased
under the Plans or
Programs (in thousands)
4/1/07 - 4/30/07
582,000
$
38.88
582,000
$
139,269
5/1/07
-
5/31/07
403,050
39.17
403,050
123,482
6/1/07 - 6/30/07
―
―
―
123,482
Total
985,050
$
39.00
985,050
$
123,482
2007
2006
2005
2004
2003
Revenues (a)
$
2,626,588
$
2,430,864
$
2,194,294
$
1,923,143
$
1,684,530
Operating income(b)(c)
164,613
204,491
137,890
178,748
157,113
Net income(b)(c)(d)
83,170
109,578
64,631
104,218
85,555
Net income per diluted share
1.82
2.36
1.39
2.26
1.89
Total assets
2,132,114
1,985,324
1,725,976
1,271,859
1,112,955
Long-term debt, including current
portion
709,231
622,269
568,776
301,143
301,757
Dividends declared
$
0.16
$
0.16
$
0.16
$
0.14
$
0.12