Supercuts 2007 Annual Report Download - page 40
Download and view the complete annual report
Please find page 40 of the 2007 Supercuts annual report below. You can navigate through the pages in the report by either clicking on the pages listed below, or by using the keyword search tool below to find specific information within the annual report.-
 1
1 -
2
-
3
-
4
-
5
-
6
-
7
-
8
-
9
-
10
-
11
-
12
-
13
-
14
-
15
-
16
-
17
-
18
-
19
-
20
-
21
-
22
-
23
-
24
-
25
-
26
-
27
-
28
-
29
-
 30
30 -
 31
31 -
 32
32 -
 33
33 -
 34
34 -
 35
35 -
 36
36 -
 37
37 -
 38
38 -
 39
39 -
 40
40 -
 41
41 -
 42
42 -
 43
43 -
 44
44 -
 45
45 -
 46
46 -
 47
47 -
 48
48 -
 49
49 -
 50
50 -
51
-
52
-
53
-
54
-
55
-
56
-
57
-
58
-
59
-
60
-
61
-
62
-
63
-
64
-
65
-
66
-
67
-
68
-
69
-
70
-
71
-
72
-
73
-
74
-
75
-
76
-
77
-
78
-
79
-
80
-
81
-
82
-
83
-
84
-
85
-
86
-
87
-
88
-
89
-
90
-
91
-
92
-
93
-
94
-
95
-
96
-
97
-
98
-
99
-
100
-
101
-
102
-
103
-
104
-
105
-
106
-
107
-
108
-
109
-
110
-
111
-
112
-
113
-
114
-
115
-
116
-
117
-
118
-
119
-
120
-
121
-
122
-
123
-
124
-
125
-
126
-
127
-
128
-
129
-
130
-
131
-
132
-
133
-
134
-
135
-
136
-
137
-
138
-
139
-
140
-
141
-
142
-
143
-
144
-
145
-
146
-
147
-
148
-
149
-
150
-
151
-
152
-
153
-
154
-
155
-
156
-
157
-
158
-
159
-
160
-
161
-
162
-
163
-
164
-
165
-
166
-
167
-
168
-
169
-
170
-
171
-
172
-
173
-
174
-
175
-
176
-
177
-
178
-
179
-
180
-
181
-
182
-
183
-
184
-
185
-
186
-
187
-
188
-
189
-
190
-
191
-
192
-
193
 |
 |

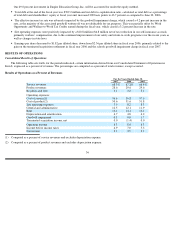
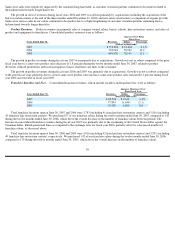
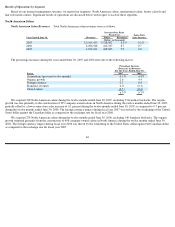
Same-store sales were negatively impacted by the sustained long-hair trend, as customer visitation patterns continued to be modest related to
the fashion trend towards longer hairstyles.
The growth in service revenues during fiscal years 2006 and 2005 was driven primarily by acquisitions (including the acquisition of the
hair restoration centers at the end of the three months ended December 31, 2004) and new salon construction (a component of organic growth).
Same-store service sales in our salons continued to be modest due to a slight lengthening of customer visitation patterns stemming from a
fashion trend towards longer hairstyles.
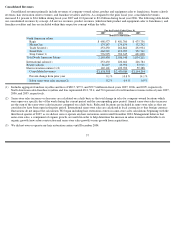
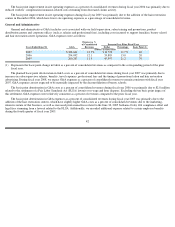
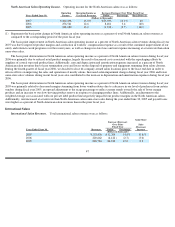
Product Revenues. Product revenues are primarily sales at company-owned salons, beauty schools, hair restoration centers, and sales of
product and equipment to franchisees. Consolidated product revenues were as follows:
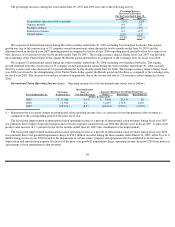
The growth in product revenues during fiscal year 2007 was primarily due to acquisitions. Growth was not as robust compared to the prior
fiscal year due to a same-store product sales decrease of 1.8 percent during the twelve months ended June 30, 2007, related to product
diversion, reduced promotions and increased appeal of mass retail hair care lines to the consumer.
The growth in product revenues during fiscal years 2006 and 2005 was primarily due to acquisitions. Growth was not as robust compared
to the prior fiscal years primarily due to a lower same-store product sales increase; same-store product sales increased 0.1 percent during fiscal
year 2006 and were flat in fiscal year 2005.
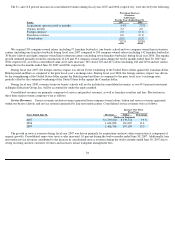
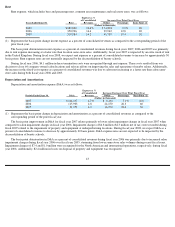
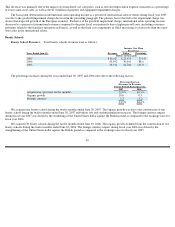
Franchise Royalties and Fees. Consolidated franchise revenues, which include royalties and franchise fees, were as follows:
Total franchise locations open at June 30, 2007 and 2006 were 3,783 (including 41 franchise hair restoration centers) and 3,816 (including
42 franchise hair restoration centers). We purchased 97 of our franchise salons during the twelve months ended June 30, 2007 compared to 142
during the twelve months ended June 30, 2006, which drove the overall decrease in the number of franchise salons between periods. The
increase in consolidated franchise revenues during fiscal year 2007 was primarily due to the weakening of the United States dollar against the
Canadian dollar, British pound and Euro as compared to the exchange rates for fiscal year 2006, partially offset by a decreased number of
franchise salons, as discussed above.
Total franchise locations open at June 30, 2006 and 2005 were 3,816 (including 42 franchise hair restoration centers) and 3,951 (including
49 franchise hair restoration centers), respectively. We purchased 142 of our franchise salons during the twelve months ended June 30, 2006
compared to 139 during the twelve months ended June 30, 2005, which drove the overall decrease in the number of franchise salons
39
Increase Over Prior
Fiscal Year
Years Ended June 30,
Revenues
Dollar
Percentage
(Dollars in thousands)
2007
$ 752,280
$ 33,338
4.6
%
2006
718,942
70,522
10.9
2005
648,420
70,141
12.1
Increase (Decrease) Over
Prior Fiscal Year
Years Ended June 30,
Revenues
Dollar
Percentage
(Dollars in thousands)
2007
$ 80,506
$ 2,612
3.4
%
2006
77,894
(1,644
)
(2.1
)
2005
79,538
5,906
8.0