Supercuts 2007 Annual Report Download - page 44
Download and view the complete annual report
Please find page 44 of the 2007 Supercuts annual report below. You can navigate through the pages in the report by either clicking on the pages listed below, or by using the keyword search tool below to find specific information within the annual report.-
 1
1 -
2
-
3
-
4
-
5
-
6
-
7
-
8
-
9
-
10
-
11
-
12
-
13
-
14
-
15
-
16
-
17
-
18
-
19
-
20
-
21
-
22
-
23
-
24
-
25
-
26
-
27
-
28
-
29
-
30
-
31
-
32
-
33
-
 34
34 -
 35
35 -
 36
36 -
 37
37 -
 38
38 -
 39
39 -
 40
40 -
 41
41 -
 42
42 -
 43
43 -
 44
44 -
 45
45 -
 46
46 -
 47
47 -
 48
48 -
 49
49 -
 50
50 -
 51
51 -
 52
52 -
 53
53 -
 54
54 -
55
-
56
-
57
-
58
-
59
-
60
-
61
-
62
-
63
-
64
-
65
-
66
-
67
-
68
-
69
-
70
-
71
-
72
-
73
-
74
-
75
-
76
-
77
-
78
-
79
-
80
-
81
-
82
-
83
-
84
-
85
-
86
-
87
-
88
-
89
-
90
-
91
-
92
-
93
-
94
-
95
-
96
-
97
-
98
-
99
-
100
-
101
-
102
-
103
-
104
-
105
-
106
-
107
-
108
-
109
-
110
-
111
-
112
-
113
-
114
-
115
-
116
-
117
-
118
-
119
-
120
-
121
-
122
-
123
-
124
-
125
-
126
-
127
-
128
-
129
-
130
-
131
-
132
-
133
-
134
-
135
-
136
-
137
-
138
-
139
-
140
-
141
-
142
-
143
-
144
-
145
-
146
-
147
-
148
-
149
-
150
-
151
-
152
-
153
-
154
-
155
-
156
-
157
-
158
-
159
-
160
-
161
-
162
-
163
-
164
-
165
-
166
-
167
-
168
-
169
-
170
-
171
-
172
-
173
-
174
-
175
-
176
-
177
-
178
-
179
-
180
-
181
-
182
-
183
-
184
-
185
-
186
-
187
-
188
-
189
-
190
-
191
-
192
-
193
 |
 |

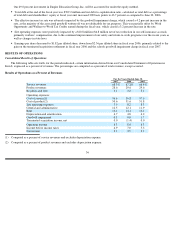
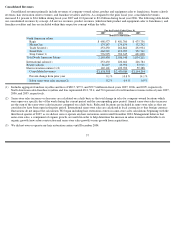
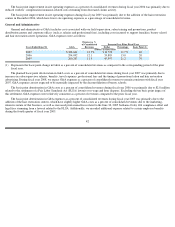
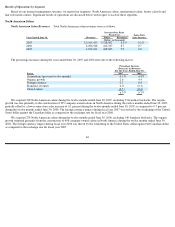
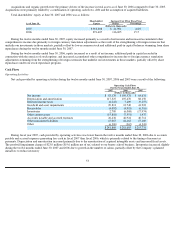
Rent
Rent expense, which includes base and percentage rent, common area maintenance and real estate taxes, was as follows:
(1)
Represents the basis point change in rent expense as a percent of consolidated revenues as compared to the corresponding period of the
prior fiscal year.
The basis point deterioration in rent expense as a percent of consolidated revenues during fiscal years 2007, 2006 and 2005 was primarily
due to rent expense increasing at a faster rate than location same-
store sales. Additionally, fiscal year 2007 is impacted by an extra week of rent
in the United Kingdom. During fiscal year 2008, we expect rent expense as a percent of consolidated revenues to increase by approximately 30
basis points. Rent expense rates are not materially impacted by the deconsolidation of beauty schools.
During fiscal year 2006, $4.1 million in lease termination costs were recognized through rent expense. These costs resulted from our
decision to close 64 company-owned salon locations and refocus efforts on improving the sales and operations of nearby salons. Additionally,
the increase in this fixed-cost expense as a percent of consolidated revenues was due to salon rent increasing at a faster rate than salon same-
store sales during both fiscal years 2006 and 2005.
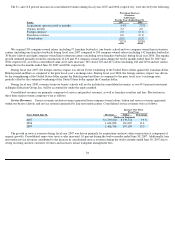
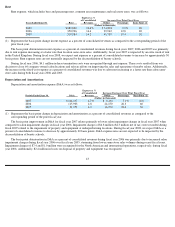
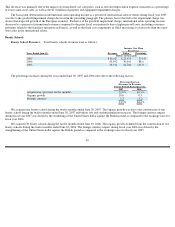
Depreciation and Amortization
Depreciation and amortization expense (D&A) was as follows:
(1)
Represents the basis point change in depreciation and amortization as a percent of consolidated revenues as compared to the
corresponding period of the prior fiscal year.
The basis point improvement in D&A for fiscal year 2007 relates primarily to lower salon impairment charges in fiscal year 2007 when
compared to salon impairment charges in fiscal year 2006. Impairment charges of $6.8 million ($4.3 million net of tax) were recorded during
fiscal 2007 related to the impairment of property and equipment at underperforming locations. During fiscal year 2008, we expect D&A as a
percent of consolidated revenues to decrease by approximately 20 basis points. D&A expense rates are not expected to be impacted by the
deconsolidation of beauty schools.
The basis point deterioration in D&A as a percent of consolidated revenues during fiscal year 2006 was primarily due to increased salon
impairment charges during fiscal year 2006 over fiscal year 2005, stemming from lower same-store sales volumes during recent fiscal years.
Impairment charges of $7.4 and $1.0 million were recognized for the North American and international operations, respectively, during fiscal
year 2006. Additionally, $2.4 million in losses on disposal of property and equipment was recognized
43
Expense as %
of Consolidated
Increase Over Prior Fiscal Year
Years Ended June 30,
Rent
Revenues
Dollar
Percentage
Basis Point
(1)
(Dollars in thousands)
2007
$
382,820
14.6
%
$
31,894
9.1
%
20
2006
350,926
14.4
39,942
12.8
20
2005
310,984
14.2
41,555
15.4
20
Expense as %
of Consolidated
Increase (Decrease) Over Prior Fiscal Year
Periods Ended June 30,
D&A
Revenues
Dollar
Percentage
Basis Point
(1)
(Dollars in thousands)
2007
$
124,137
4.7
%
$
8,234
7.1
%
(10
)
2006
115,903
4.8
24,150
26.3
60
2005
91,753
4.2
16,770
22.4
30