Supercuts 2007 Annual Report Download - page 27
Download and view the complete annual report
Please find page 27 of the 2007 Supercuts annual report below. You can navigate through the pages in the report by either clicking on the pages listed below, or by using the keyword search tool below to find specific information within the annual report.-
 1
1 -
2
-
3
-
4
-
5
-
6
-
7
-
8
-
9
-
10
-
11
-
12
-
13
-
14
-
15
-
16
-
 17
17 -
 18
18 -
 19
19 -
 20
20 -
 21
21 -
 22
22 -
 23
23 -
 24
24 -
 25
25 -
 26
26 -
 27
27 -
 28
28 -
 29
29 -
 30
30 -
 31
31 -
 32
32 -
 33
33 -
 34
34 -
 35
35 -
 36
36 -
 37
37 -
38
-
39
-
40
-
41
-
42
-
43
-
44
-
45
-
46
-
47
-
48
-
49
-
50
-
51
-
52
-
53
-
54
-
55
-
56
-
57
-
58
-
59
-
60
-
61
-
62
-
63
-
64
-
65
-
66
-
67
-
68
-
69
-
70
-
71
-
72
-
73
-
74
-
75
-
76
-
77
-
78
-
79
-
80
-
81
-
82
-
83
-
84
-
85
-
86
-
87
-
88
-
89
-
90
-
91
-
92
-
93
-
94
-
95
-
96
-
97
-
98
-
99
-
100
-
101
-
102
-
103
-
104
-
105
-
106
-
107
-
108
-
109
-
110
-
111
-
112
-
113
-
114
-
115
-
116
-
117
-
118
-
119
-
120
-
121
-
122
-
123
-
124
-
125
-
126
-
127
-
128
-
129
-
130
-
131
-
132
-
133
-
134
-
135
-
136
-
137
-
138
-
139
-
140
-
141
-
142
-
143
-
144
-
145
-
146
-
147
-
148
-
149
-
150
-
151
-
152
-
153
-
154
-
155
-
156
-
157
-
158
-
159
-
160
-
161
-
162
-
163
-
164
-
165
-
166
-
167
-
168
-
169
-
170
-
171
-
172
-
173
-
174
-
175
-
176
-
177
-
178
-
179
-
180
-
181
-
182
-
183
-
184
-
185
-
186
-
187
-
188
-
189
-
190
-
191
-
192
-
193
 |
 |
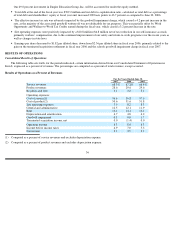
PART II
Item 5.
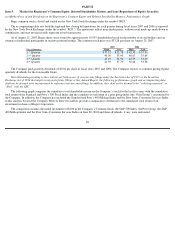
Market for Registrant’s Common Equity, Related Stockholder Matters and Issue Repurchase of Equity Securities
(a) Market Price of and Dividends on the Registrant’s Common Equity and Related Stockholder Matters; Performance Graph
Regis common stock is listed and traded on the New York Stock Exchange under the symbol “RGS.”
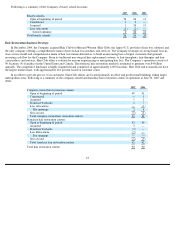
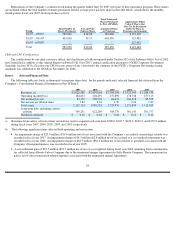
The accompanying table sets forth the high and low closing bid quotations for each quarter during fiscal years 2007 and 2006 as reported
by the New York Stock Exchange (under the symbol “RGS”). The quotations reflect inter-dealer prices, without retail mark-up, mark-down or
commission, and may not necessarily represent actual transactions.
As of August 21, 2007, Regis shares were owned by approximately 19,935 shareholders based on the number of record holders and an
estimate of individual participants in security position listings. The common stock price was $33.28 per share on August 23, 2007.
The Company paid quarterly dividends of $0.04 per share in fiscal years 2007 and 2006. The Company expects to continue paying regular
quarterly dividends for the foreseeable future.
Notwithstanding anything to the contrary set forth in any of our previous filings under the Securities Act of 1933 or the Securities
Exchange Act of 1934 that might incorporate future filings or this Annual Report, the following performance graph and accompanying data
shall not be deemed to be incorporated by reference into any such filings. In addition, they shall not be deemed to be “soliciting material” or
“filed” with the SEC.
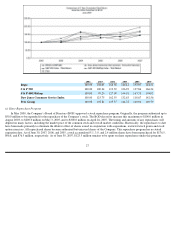
The following graph compares the cumulative total shareholder return on the Company’s stock for the last five years with the cumulative
total return of the Standard and Poor’s 500 Stock Index and the cumulative total return of a peer group index (the “Peer Group”)
constructed by
the Company. In addition, the Company has included the Standard and Poor’s 400 Midcap Index and the Dow Jones Consumer Services Index
in this analysis because the Company believes these two indices provide a comparative correlation to the cumulative total return of an
investment in shares of Regis Corporation.
The comparison assumes the initial investment of $100 in the Company’s Common Stock, the S&P 500 Index, the Peer Group, the S&P
400 Midcap Index and the Dow Jones Consumer Services Index on June 30, 2002 and those dividends, if any, were reinvested.
26
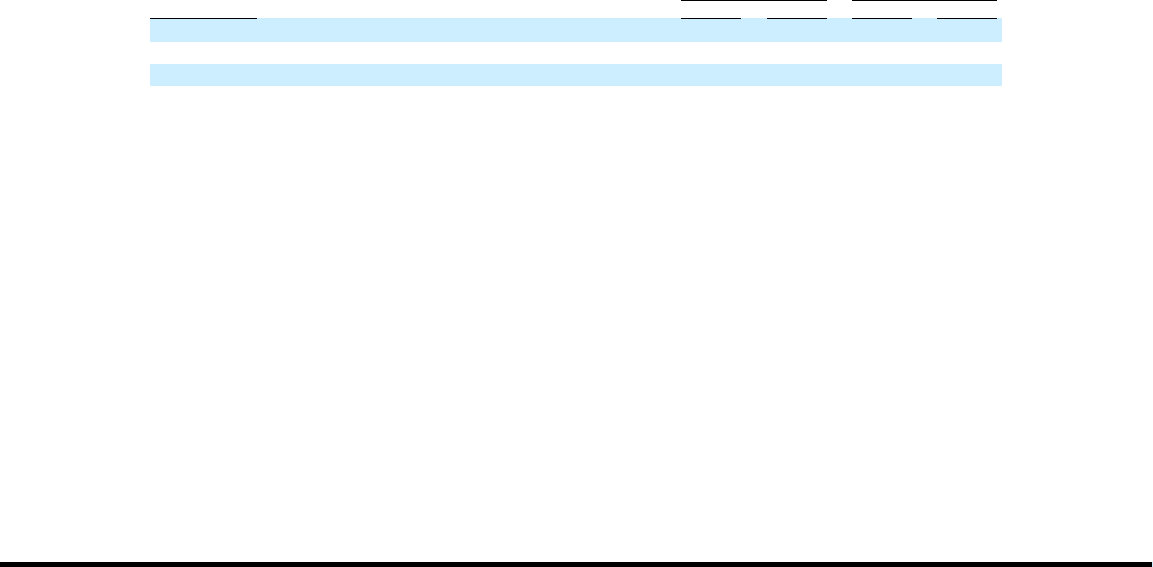
2007
2006
Fiscal Quarter
High
Low
High
Low
1 Quarter
$
37.32
$
32.78
$
42.30
$
37.30
2
Quarter
40.30
35.90
40.67
35.64
3
Quarter
43.29
38.90
42.59
33.49
4
Quarter
41.59
37.79
36.26
33.38
st
nd
rd
th