Supercuts 2007 Annual Report Download - page 50
Download and view the complete annual report
Please find page 50 of the 2007 Supercuts annual report below. You can navigate through the pages in the report by either clicking on the pages listed below, or by using the keyword search tool below to find specific information within the annual report.-
 1
1 -
2
-
3
-
4
-
5
-
6
-
7
-
8
-
9
-
10
-
11
-
12
-
13
-
14
-
15
-
16
-
17
-
18
-
19
-
20
-
21
-
22
-
23
-
24
-
25
-
26
-
27
-
28
-
29
-
30
-
31
-
32
-
33
-
34
-
35
-
36
-
37
-
38
-
39
-
 40
40 -
 41
41 -
 42
42 -
 43
43 -
 44
44 -
 45
45 -
 46
46 -
 47
47 -
 48
48 -
 49
49 -
 50
50 -
 51
51 -
 52
52 -
 53
53 -
 54
54 -
 55
55 -
 56
56 -
 57
57 -
 58
58 -
 59
59 -
 60
60 -
61
-
62
-
63
-
64
-
65
-
66
-
67
-
68
-
69
-
70
-
71
-
72
-
73
-
74
-
75
-
76
-
77
-
78
-
79
-
80
-
81
-
82
-
83
-
84
-
85
-
86
-
87
-
88
-
89
-
90
-
91
-
92
-
93
-
94
-
95
-
96
-
97
-
98
-
99
-
100
-
101
-
102
-
103
-
104
-
105
-
106
-
107
-
108
-
109
-
110
-
111
-
112
-
113
-
114
-
115
-
116
-
117
-
118
-
119
-
120
-
121
-
122
-
123
-
124
-
125
-
126
-
127
-
128
-
129
-
130
-
131
-
132
-
133
-
134
-
135
-
136
-
137
-
138
-
139
-
140
-
141
-
142
-
143
-
144
-
145
-
146
-
147
-
148
-
149
-
150
-
151
-
152
-
153
-
154
-
155
-
156
-
157
-
158
-
159
-
160
-
161
-
162
-
163
-
164
-
165
-
166
-
167
-
168
-
169
-
170
-
171
-
172
-
173
-
174
-
175
-
176
-
177
-
178
-
179
-
180
-
181
-
182
-
183
-
184
-
185
-
186
-
187
-
188
-
189
-
190
-
191
-
192
-
193
 |
 |

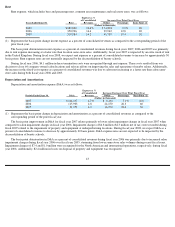
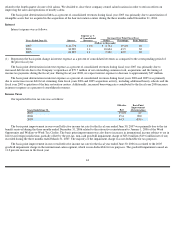
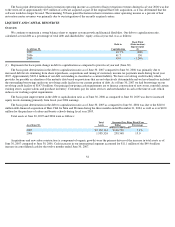
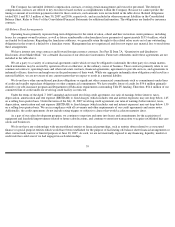
This decrease was primarily due to the impact of certain fixed cost categories, such as rent and depreciation expense, measured as a percentage
of lower same-store sales, as well as the $1.0 million of property and equipment impairment charges.
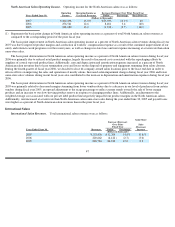
The basis point deterioration in international salon operating income as a percent of international salon revenues during fiscal year 2005
was due to the goodwill impairment charge discussed in the preceding paragraph. The primary factor that led to the impairment charge was
slower than expected growth of the European economy. Exclusive of the goodwill impairment charge, international salon operating income
decreased as a percent of international revenues compared to the prior fiscal year primarily due to higher payroll costs (including severance
payments related to the franchise operations in France), as well as the fixed cost components of G&A increasing at a faster rate than the same-
store sales in the international salons.
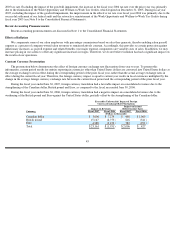
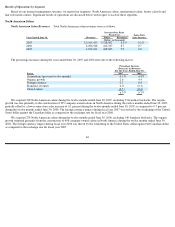
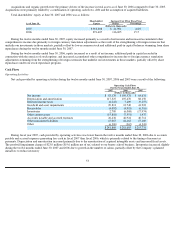
Beauty Schools
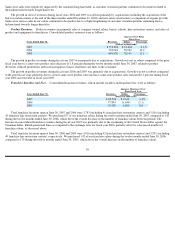
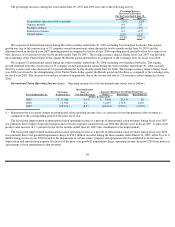
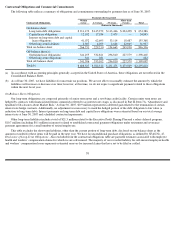
Beauty School Revenues. Total beauty schools revenues were as follows:
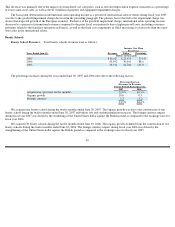
The percentage increases during the years ended June 30, 2007 and 2006 were due to the following factors:
We acquired one beauty school during the twelve months ended June 30, 2007. The organic growth was due to the construction of one
beauty school during the twelve months ended June 30, 2007 and tuition rate and student population increases. The foreign currency impact
during fiscal year 2007 was driven by the weakening of the United States dollar against the British pound as compared to the exchange rates for
fiscal year 2006.
We acquired 30 beauty schools during the twelve months ended June 30, 2006. The organic growth stemmed from the construction of two
beauty schools during the twelve months ended June 30, 2006. The foreign currency impact during fiscal year 2006 was driven by the
strengthening of the United States dollar against the British pound as compared to the exchange rates for fiscal year 2005.
49
Increase Over Prior
Fiscal Year
Years Ended June 30,
Revenues
Dollar
Percentage
(Dollars in thousands)
2007
$
85,627
$
21,675
33.9
%
2006
63,952
30,041
88.6
2005
33,911
18,768
123.9
Percentage Increase
(Decrease) in Revenues
For the Periods Ended June 30,
2007
2006
Acquisitions (previous twelve months)
22.0
%
89.3
%
Organic growth
10.6
0.5
Foreign currency
1.3
(1.2
)
33.9
%
88.6
%