Supercuts 2007 Annual Report Download - page 35
Download and view the complete annual report
Please find page 35 of the 2007 Supercuts annual report below. You can navigate through the pages in the report by either clicking on the pages listed below, or by using the keyword search tool below to find specific information within the annual report.-
 1
1 -
2
-
3
-
4
-
5
-
6
-
7
-
8
-
9
-
10
-
11
-
12
-
13
-
14
-
15
-
16
-
17
-
18
-
19
-
20
-
21
-
22
-
23
-
24
-
 25
25 -
 26
26 -
 27
27 -
 28
28 -
 29
29 -
 30
30 -
 31
31 -
 32
32 -
 33
33 -
 34
34 -
 35
35 -
 36
36 -
 37
37 -
 38
38 -
 39
39 -
 40
40 -
 41
41 -
 42
42 -
 43
43 -
 44
44 -
 45
45 -
46
-
47
-
48
-
49
-
50
-
51
-
52
-
53
-
54
-
55
-
56
-
57
-
58
-
59
-
60
-
61
-
62
-
63
-
64
-
65
-
66
-
67
-
68
-
69
-
70
-
71
-
72
-
73
-
74
-
75
-
76
-
77
-
78
-
79
-
80
-
81
-
82
-
83
-
84
-
85
-
86
-
87
-
88
-
89
-
90
-
91
-
92
-
93
-
94
-
95
-
96
-
97
-
98
-
99
-
100
-
101
-
102
-
103
-
104
-
105
-
106
-
107
-
108
-
109
-
110
-
111
-
112
-
113
-
114
-
115
-
116
-
117
-
118
-
119
-
120
-
121
-
122
-
123
-
124
-
125
-
126
-
127
-
128
-
129
-
130
-
131
-
132
-
133
-
134
-
135
-
136
-
137
-
138
-
139
-
140
-
141
-
142
-
143
-
144
-
145
-
146
-
147
-
148
-
149
-
150
-
151
-
152
-
153
-
154
-
155
-
156
-
157
-
158
-
159
-
160
-
161
-
162
-
163
-
164
-
165
-
166
-
167
-
168
-
169
-
170
-
171
-
172
-
173
-
174
-
175
-
176
-
177
-
178
-
179
-
180
-
181
-
182
-
183
-
184
-
185
-
186
-
187
-
188
-
189
-
190
-
191
-
192
-
193
 |
 |

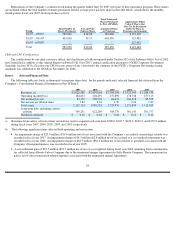
impairment is measured by the difference between the assets’ carrying amount and their fair value, based on the best information available,
including market prices or discounted cash flow analysis. During fiscal years 2007, 2006 and 2005, $6.8, $8.4, and $3.6 million of impairment
was recorded within depreciation and amortization in the Consolidated Statement of Operations.
Judgments made by management related to the expected useful lives of long-
lived assets and the ability to realize undiscounted cash flows
in excess of the carrying amounts of such assets are affected by factors such as the ongoing maintenance and improvement of the assets,
changes in economic conditions and changes in operating performance. As the ongoing expected cash flows and carrying amounts of long-
lived assets are assessed, these factors could cause us to realize material impairment charges.
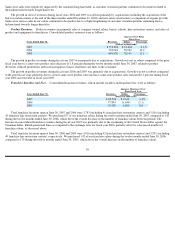
Purchase Price Allocation
We make numerous acquisitions. The purchase prices are allocated to assets acquired, including identifiable intangible assets, and
liabilities assumed based on their estimated fair values at the dates of acquisition. Fair value is estimated based on the amount for which the
asset or liability could be bought or sold in a current transaction between willing parties. For our acquisitions, the majority of the purchase price
that is not allocated to identifiable assets, or liabilities assumed, is accounted for as residual goodwill rather than identifiable intangible assets.
This stems from the value associated with the walk-in customer base of the acquired salons, the value of which is not recorded as an
identifiable intangible asset under current accounting guidance and the limited value of the acquired leased site and customer preference
associated with the acquired hair salon brand. Residual goodwill further represents our opportunity to strategically combine the acquired
business with our existing structure to serve a greater number of customers through our expansion strategies. Identifiable intangible assets
purchased in fiscal year 2007, 2006 and 2005 acquisitions totaled $4.5, $17.3, and $9.3 million, respectively. The residual goodwill generated
by fiscal year 2007, 2006, and 2005 acquisitions totaled $50.8, $127.3, and $92.3 million, respectively.
Self-insurance Accruals
We use a combination of third party insurance and self-insurance for a number of risks including workers’ compensation, health
insurance, employment practice liability and general liability claims. The liability reflected on our Consolidated Balance Sheet represents an
estimate of the undiscounted ultimate cost of uninsured claims incurred as of the balance sheet date. In estimating this liability, we utilize loss
development factors prepared by independent third party actuaries. These development factors utilize historical data to project the future
development of incurred losses. Loss estimates are adjusted based upon actual claims settlements and reported claims. Although we do not
expect the amounts ultimately paid to differ significantly from the estimates, self-insurance accruals could be affected if future claims
experience differs significantly from the historical trends and actuarial assumptions. We recorded a positive adjustment to our self-insurance
accruals of $10.8 million ($6.8 million net of tax) during fiscal year 2007. The reserve reduction relates primarily to an actuarial reduction in
prior years workers’ compensation claims reserves as a result of continued improvement of our new safety and return-to-work programs over
the recent years as well as changes in state laws. In fiscal 2006 and 2005 we increased self-insurance accruals related to prior years claims by
$1.0 and $2.3 million, respectively. During fiscal years 2007, 2006, and 2005, our insurance costs were $29.7, $40.5 and $38.2 million,
respectively.
Income Taxes
In determining income for financial statement purposes, management must make certain estimates and judgments. These estimates and
judgments occur in the calculation of certain tax liabilities and in the determination of the recoverability of certain deferred tax assets, which
arise from temporary differences between the tax and financial statement recognition of revenue and expense.
34