Supercuts 2004 Annual Report Download - page 91
Download and view the complete annual report
Please find page 91 of the 2004 Supercuts annual report below. You can navigate through the pages in the report by either clicking on the pages listed below, or by using the keyword search tool below to find specific information within the annual report.-
 1
1 -
2
-
3
-
4
-
5
-
6
-
7
-
8
-
9
-
10
-
11
-
12
-
13
-
14
-
15
-
16
-
17
-
18
-
19
-
20
-
21
-
22
-
23
-
24
-
25
-
26
-
27
-
28
-
29
-
30
-
31
-
32
-
33
-
34
-
35
-
36
-
37
-
38
-
39
-
40
-
41
-
42
-
43
-
44
-
45
-
46
-
47
-
48
-
49
-
50
-
51
-
52
-
53
-
54
-
55
-
56
-
57
-
58
-
59
-
60
-
61
-
62
-
63
-
64
-
65
-
66
-
67
-
68
-
69
-
70
-
71
-
72
-
73
-
74
-
75
-
76
-
77
-
78
-
79
-
80
-
 81
81 -
 82
82 -
 83
83 -
 84
84 -
 85
85 -
 86
86 -
 87
87 -
 88
88 -
 89
89 -
 90
90 -
 91
91 -
 92
92 -
 93
93 -
 94
94 -
 95
95 -
 96
96 -
 97
97 -
 98
98 -
 99
99 -
 100
100 -
 101
101 -
102
-
103
-
104
-
105
-
106
-
107
-
108
-
109
-
110
-
111
-
112
-
113
-
114
-
115
-
116
-
117
-
118
-
119
-
120
-
121
-
122
-
123
-
124
-
125
-
126
-
127
-
128
-
129
-
130
-
131
-
132
-
133
-
134
-
135
-
136
-
137
-
138
-
139
-
140
-
141
-
142
-
143
-
144
-
145
-
146
-
147
-
148
 |
 |

Table of Contents
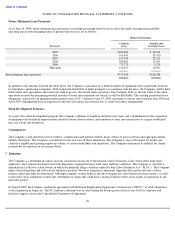
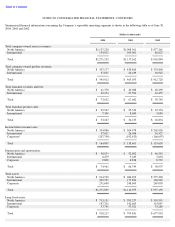
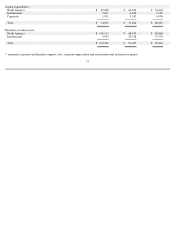
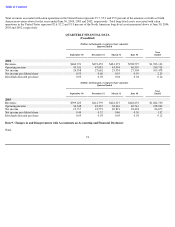
Total revenues associated with salon operations in the United States represent 95.7, 95.9 and 95.9 percent of the amounts set forth as North
American revenues above for the years ended June 30, 2004, 2003 and 2002, respectively. Total long-lived assets associated with salon
operations in the United States represent 92.6, 92.2 and 91.9 percent of the North American long-
lived assets presented above at June 30, 2004,
2003 and 2002, respectively.
QUARTERLY FINANCIAL DATA
(Unaudited)
Item 9. Changes in and Disagreements with Accountants on Accounting and Financial Disclosure
None.
74
(Dollars in thousands, except per share amounts)
Quarter Ended
Year
September 30
December 31
March 31
June 30
Ended
2004
Revenues
$
460,721
$
472,452
$
481,373
$
508,597
$
1,923,143
Operating income
43,331
47,083
43,994
46,310
180,718
Net income
24,958
27,662
25,554
27,304
105,478
Net income per diluted share
0.55
0.60
0.55
0.59
2.29
Dividends declared per share
0.03
0.03
0.04
0.04
0.14
(Dollars in thousands, except per share amounts)
Quarter Ended
Year
September 30
December 31
March 31
June 30
Ended
2003
Revenues
$
399,223
$
414,759
$
422,315
$
448,233
$
1,684,530
Operating income
36,348
43,235
38,616
40,741
158,940
Net income
19,717
23,573
20,891
22,494
86,675
Net income per diluted share
0.44
0.52
0.46
0.50
1.92
Dividends declared per share
0.03
0.03
0.03
0.03
0.12