Supercuts 2004 Annual Report Download - page 40
Download and view the complete annual report
Please find page 40 of the 2004 Supercuts annual report below. You can navigate through the pages in the report by either clicking on the pages listed below, or by using the keyword search tool below to find specific information within the annual report.-
 1
1 -
2
-
3
-
4
-
5
-
6
-
7
-
8
-
9
-
10
-
11
-
12
-
13
-
14
-
15
-
16
-
17
-
18
-
19
-
20
-
21
-
22
-
23
-
24
-
25
-
26
-
27
-
28
-
29
-
 30
30 -
 31
31 -
 32
32 -
 33
33 -
 34
34 -
 35
35 -
 36
36 -
 37
37 -
 38
38 -
 39
39 -
 40
40 -
 41
41 -
 42
42 -
 43
43 -
 44
44 -
 45
45 -
 46
46 -
 47
47 -
 48
48 -
 49
49 -
 50
50 -
51
-
52
-
53
-
54
-
55
-
56
-
57
-
58
-
59
-
60
-
61
-
62
-
63
-
64
-
65
-
66
-
67
-
68
-
69
-
70
-
71
-
72
-
73
-
74
-
75
-
76
-
77
-
78
-
79
-
80
-
81
-
82
-
83
-
84
-
85
-
86
-
87
-
88
-
89
-
90
-
91
-
92
-
93
-
94
-
95
-
96
-
97
-
98
-
99
-
100
-
101
-
102
-
103
-
104
-
105
-
106
-
107
-
108
-
109
-
110
-
111
-
112
-
113
-
114
-
115
-
116
-
117
-
118
-
119
-
120
-
121
-
122
-
123
-
124
-
125
-
126
-
127
-
128
-
129
-
130
-
131
-
132
-
133
-
134
-
135
-
136
-
137
-
138
-
139
-
140
-
141
-
142
-
143
-
144
-
145
-
146
-
147
-
148
 |
 |

Table of Contents
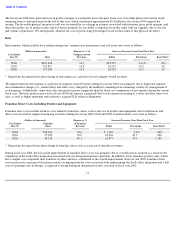
The fiscal year 2004 basis point decrease in product margins was primarily due to the prior fiscal year’s favorable physical inventory result
stemming from a count performed in the fall of that year, which contributed approximately $2.8 million to fiscal year 2003 reported net
income. The favorable physical inventory result was accounted for as a change in estimate associated with inventory gross profit margins (and
thus reduced the cost of product sales) and was driven primarily by our ability to negotiate favorable terms with our suppliers due to our size
and volume of purchases. We subsequently adjusted our cost of goods usage percentages based on the results of this physical inventory.
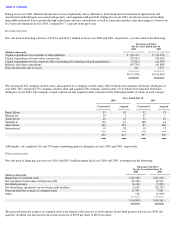
Rent
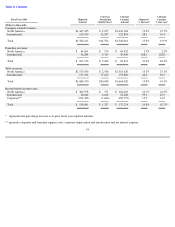
Rent expense, which includes base and percentage rent, common area maintenance and real estate taxes were as follows:
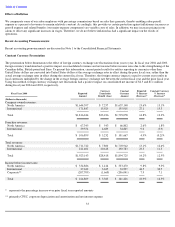
The improvement in rent expense as a percent of company-owned revenues during fiscal year 2004 was primarily due to improved common
area maintenance charges (i.e., shared utility and other costs) charged by the landlords stemming from continuing scrutiny by management of
such expenses. Additionally, same-store sales increased in greater magnitude than the fixed cost components of rent expense during the current
fiscal year. The basis point increase in fiscal year 2003 rent expense is primarily due to rent expense increasing at a faster rate than same-store
sales, as well as higher minimum rents related to acquired JLD salons in Manhattan.
Franchise Direct Costs, Including Product and Equipment
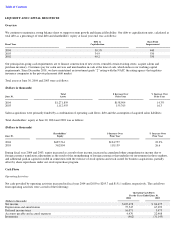
Franchise direct costs include all direct costs related to franchise salons, such as the cost of product and equipment sold to franchisees and
direct costs incurred to support franchising activities. During fiscal year 2004, 2003 and 2002, franchise direct costs were as follows:
During fiscal year 2004, the basis point improvement in franchise direct costs was primarily due to cost efficiencies realized as a result of the
completion of the back-office integration associated with our European franchise operations. In addition, lower franchise product sales, which
have a higher cost component than franchise royalties and fees, contributed to the overall improvement. In fiscal year 2003, franchise direct
costs increased as a percent of franchise revenues stemming from the costs associated with implementing this back-office integration and a full
year of operating costs in Europe, as opposed to having European operations for only a fraction of fiscal year 2002.
31
(Dollars in thousands)
Expense as % of
Increase (Decrease) Over Prior Fiscal Year
Year Ended
Company-owned
June 30,
Rent
Revenues
Dollar
Percentage
Basis Point*
2004
$
267,368
14.7
$
33,547
14.3
%
(10
)
2003
233,821
14.8
36,552
18.5
50
2002
197,269
14.3
20,322
11.5
20
*
Represents the annual basis point change in rent expense as a percent of total company
-
owned revenues.
(Dollars in thousands)
Expense as %
Increase (Decrease) Over Prior Fiscal Year
Year Ended
Franchise
of Franchise
June 30,
Direct
Revenues
Dollar
Percentage
Basis Point*
2004
$
58,413
54.6
$
1,363
2.4
%
(140
)
2003
57,050
56.0
18,936
49.7
690
2002
38,114
49.1
16,877
79.5
1,140
*
Represents the annual basis point change in franchise direct costs as a percent of franchise revenues.