Supercuts 2004 Annual Report Download - page 36
Download and view the complete annual report
Please find page 36 of the 2004 Supercuts annual report below. You can navigate through the pages in the report by either clicking on the pages listed below, or by using the keyword search tool below to find specific information within the annual report.-
 1
1 -
2
-
3
-
4
-
5
-
6
-
7
-
8
-
9
-
10
-
11
-
12
-
13
-
14
-
15
-
16
-
17
-
18
-
19
-
20
-
21
-
22
-
23
-
24
-
25
-
 26
26 -
 27
27 -
 28
28 -
 29
29 -
 30
30 -
 31
31 -
 32
32 -
 33
33 -
 34
34 -
 35
35 -
 36
36 -
 37
37 -
 38
38 -
 39
39 -
 40
40 -
 41
41 -
 42
42 -
 43
43 -
 44
44 -
 45
45 -
 46
46 -
47
-
48
-
49
-
50
-
51
-
52
-
53
-
54
-
55
-
56
-
57
-
58
-
59
-
60
-
61
-
62
-
63
-
64
-
65
-
66
-
67
-
68
-
69
-
70
-
71
-
72
-
73
-
74
-
75
-
76
-
77
-
78
-
79
-
80
-
81
-
82
-
83
-
84
-
85
-
86
-
87
-
88
-
89
-
90
-
91
-
92
-
93
-
94
-
95
-
96
-
97
-
98
-
99
-
100
-
101
-
102
-
103
-
104
-
105
-
106
-
107
-
108
-
109
-
110
-
111
-
112
-
113
-
114
-
115
-
116
-
117
-
118
-
119
-
120
-
121
-
122
-
123
-
124
-
125
-
126
-
127
-
128
-
129
-
130
-
131
-
132
-
133
-
134
-
135
-
136
-
137
-
138
-
139
-
140
-
141
-
142
-
143
-
144
-
145
-
146
-
147
-
148
 |
 |

Table of Contents
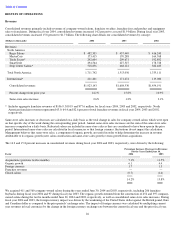
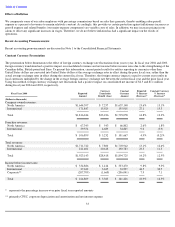
Consolidated Revenues. North American and international revenues are primarily comprised of company-
owned service and product revenues,
as well as franchise revenues from franchise fees and royalties, and product and equipment sales to franchisees. Fluctuations in these three
revenue categories were as follows:
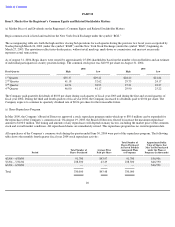
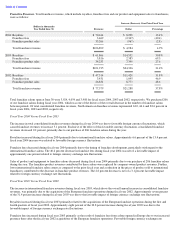
Service Revenues. Service revenues were as follows:
The growth in service revenues in fiscal years 2004 and 2003 was driven by acquisitions and organic growth (new salon construction and
same-store sales growth). Fiscal year 2003 same-store service sales increases were not as robust as in the prior year due to a weaker
economic climate. During fiscal year 2004, same-store service sales continued to be modest due to a slight lengthening of customer
visitation patterns stemming from a fashion trend towards longer hairstyles, as well as a continuing weak economic climate.
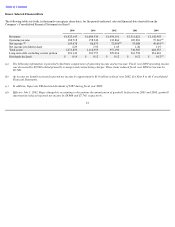
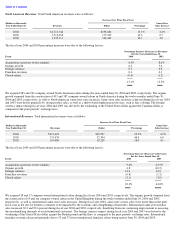
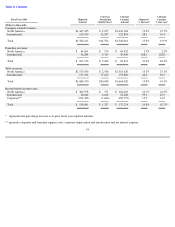
Product Revenues. Product revenues were as follows:
The increases in product revenues demonstrate our strength in merchandising professional salon products. During fiscal year 2004, product
revenues increased 60 basis points to 30.0 percent of total company-owned revenues. This increase is due primarily to strong same-store
product sales, coupled with modest same-store service sales growth. Same-store product sales increases were more robust than in the prior
fiscal year primarily due to continual improvement in our merchandising execution, with emphasis placed on management of promotional
buying and new product lines. Our merchandising strategy recognizes and stresses the importance of product education and
communication with the salons. In addition, the sale of beauty tools, such as flat irons, was a strong contributor to the increased same-store
product sales, particularly in Trade Secret and the international salons.
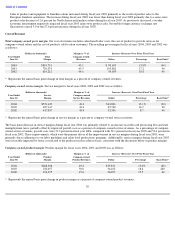
In fiscal year 2003, product revenues as a percent of total company-
owned revenues decreased to 29.4 percent, compared to 30.0 percent of
revenues in fiscal year 2002. The decrease as a percent of company-owned sales during fiscal year 2003 was primarily due to the large
number of strip center salons which were acquired over the twelve months ended June 30, 2003. Strip center salons have a lower product
sales mix than the corporate average. Same-
store product sales increases were lower during fiscal year 2003 than in the prior year primarily
due to decreased mall traffic, as well as a weaker economy.
28
(Dollars in thousands)
Increase Over Prior Fiscal Year
Same
-
Store
Year Ended June 30,
Revenues
Dollar
Percentage
Sales Increase
2004
$
1,271,232
$
153,670
13.8
%
0.3
%
2003
1,117,562
153,678
15.9
0.4
2002
963,884
70,412
7.9
1.5
(Dollars in thousands)
Increase Over Prior Fiscal Year
Same-Store
Year Ended June 30,
Revenues
Dollar
Percentage
Sales Increase
2004
$
545,012
$
79,959
17.2
%
8.1
%
2003
465,053
52,325
12.7
2.9
2002
412,728
50,870
14.1
7.1