Supercuts 2004 Annual Report Download - page 44
Download and view the complete annual report
Please find page 44 of the 2004 Supercuts annual report below. You can navigate through the pages in the report by either clicking on the pages listed below, or by using the keyword search tool below to find specific information within the annual report.-
 1
1 -
2
-
3
-
4
-
5
-
6
-
7
-
8
-
9
-
10
-
11
-
12
-
13
-
14
-
15
-
16
-
17
-
18
-
19
-
20
-
21
-
22
-
23
-
24
-
25
-
26
-
27
-
28
-
29
-
30
-
31
-
32
-
33
-
 34
34 -
 35
35 -
 36
36 -
 37
37 -
 38
38 -
 39
39 -
 40
40 -
 41
41 -
 42
42 -
 43
43 -
 44
44 -
 45
45 -
 46
46 -
 47
47 -
 48
48 -
 49
49 -
 50
50 -
 51
51 -
 52
52 -
 53
53 -
 54
54 -
55
-
56
-
57
-
58
-
59
-
60
-
61
-
62
-
63
-
64
-
65
-
66
-
67
-
68
-
69
-
70
-
71
-
72
-
73
-
74
-
75
-
76
-
77
-
78
-
79
-
80
-
81
-
82
-
83
-
84
-
85
-
86
-
87
-
88
-
89
-
90
-
91
-
92
-
93
-
94
-
95
-
96
-
97
-
98
-
99
-
100
-
101
-
102
-
103
-
104
-
105
-
106
-
107
-
108
-
109
-
110
-
111
-
112
-
113
-
114
-
115
-
116
-
117
-
118
-
119
-
120
-
121
-
122
-
123
-
124
-
125
-
126
-
127
-
128
-
129
-
130
-
131
-
132
-
133
-
134
-
135
-
136
-
137
-
138
-
139
-
140
-
141
-
142
-
143
-
144
-
145
-
146
-
147
-
148
 |
 |

Table of Contents
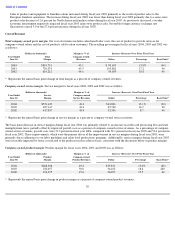
34
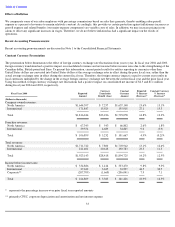
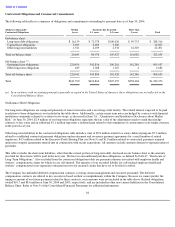
Currency
Constant
Constant
Fiscal Year 2003
Reported
Translation
Currency
Reported
Currency
(Dollars in thousands)
Amount
Benefit (Loss)
Amount
% Increase*
% Increase*
Company
-
owned revenues:
North America
$
1,447,425
$
2,257
$
1,445,168
13.9
%
13.7
%
International
135,190
12,297
122,893
28.1
16.4
Total
$
1,582,615
$
14,554
$
1,568,061
15.0
%
13.9
%
Franchise revenues:
North America
$
65,631
$
179
$
65,452
2.5
%
2.2
%
International
36,284
5,315
30,969
168.1
128.8
Total
$
101,915
$
5,494
$
96,421
31.4
%
24.3
%
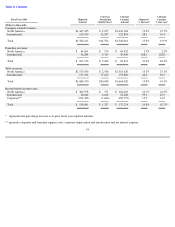
Total revenues:
North America
$
1,513,056
$
2,436
$
1,510,620
13.3
%
13.1
%
International
171,474
17,612
153,862
44.0
29.2
Total
$
1,684,530
$
20,048
$
1,664,482
15.8
%
14.5
%
Income before income taxes:
North America
$
304,978
$
375
$
304,603
14.7
%
14.5
%
International
26,046
2,618
23,428
59.5
43.5
Corporate**
(192,423
)
(1,666
)
(190,757
)
15.5
14.5
Total
$
138,601
$
1,327
$
137,274
19.8
%
18.7
%
*
represents the percentage increase over prior fiscal year reported amounts
**
primarily corporate and franchise support costs, corporate depreciation and amortization and net interest expense