Supercuts 2004 Annual Report Download - page 74
Download and view the complete annual report
Please find page 74 of the 2004 Supercuts annual report below. You can navigate through the pages in the report by either clicking on the pages listed below, or by using the keyword search tool below to find specific information within the annual report.-
 1
1 -
2
-
3
-
4
-
5
-
6
-
7
-
8
-
9
-
10
-
11
-
12
-
13
-
14
-
15
-
16
-
17
-
18
-
19
-
20
-
21
-
22
-
23
-
24
-
25
-
26
-
27
-
28
-
29
-
30
-
31
-
32
-
33
-
34
-
35
-
36
-
37
-
38
-
39
-
40
-
41
-
42
-
43
-
44
-
45
-
46
-
47
-
48
-
49
-
50
-
51
-
52
-
53
-
54
-
55
-
56
-
57
-
58
-
59
-
60
-
61
-
62
-
63
-
 64
64 -
 65
65 -
 66
66 -
 67
67 -
 68
68 -
 69
69 -
 70
70 -
 71
71 -
 72
72 -
 73
73 -
 74
74 -
 75
75 -
 76
76 -
 77
77 -
 78
78 -
 79
79 -
 80
80 -
 81
81 -
 82
82 -
 83
83 -
 84
84 -
85
-
86
-
87
-
88
-
89
-
90
-
91
-
92
-
93
-
94
-
95
-
96
-
97
-
98
-
99
-
100
-
101
-
102
-
103
-
104
-
105
-
106
-
107
-
108
-
109
-
110
-
111
-
112
-
113
-
114
-
115
-
116
-
117
-
118
-
119
-
120
-
121
-
122
-
123
-
124
-
125
-
126
-
127
-
128
-
129
-
130
-
131
-
132
-
133
-
134
-
135
-
136
-
137
-
138
-
139
-
140
-
141
-
142
-
143
-
144
-
145
-
146
-
147
-
148
 |
 |
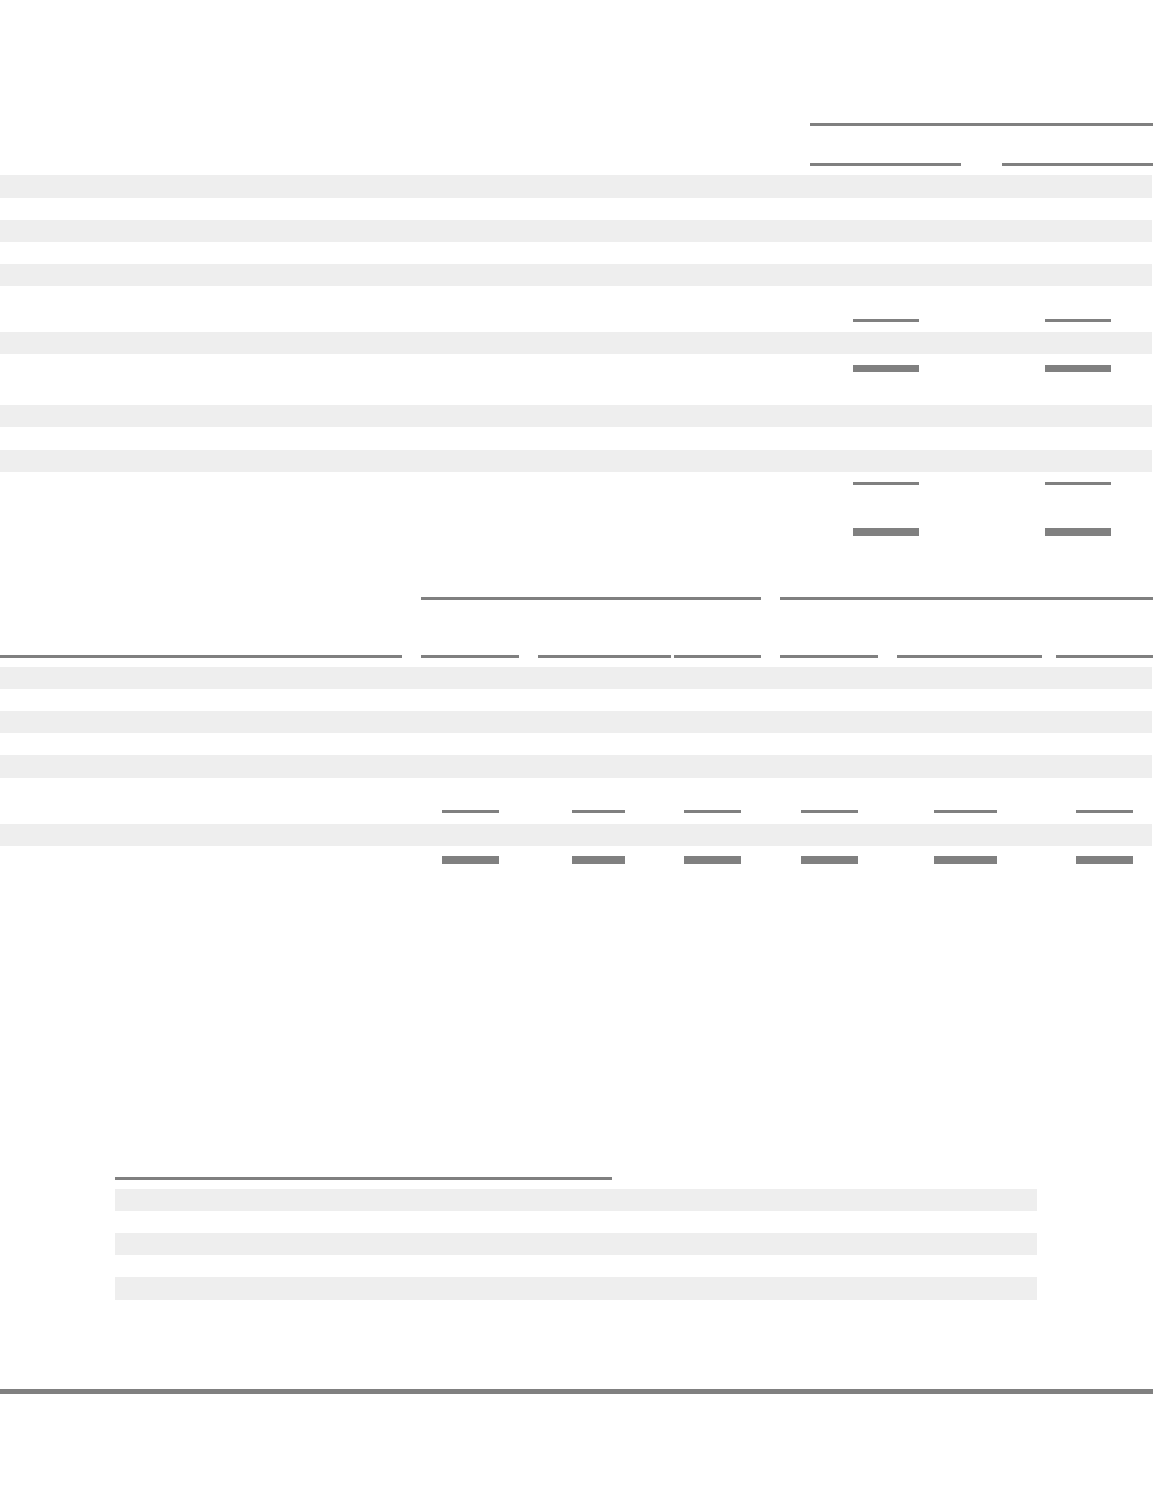
Table of Contents
NOTES TO CONSOLIDATED FINANCIAL STATEMENTS, CONTINUED
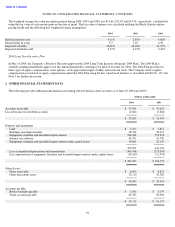
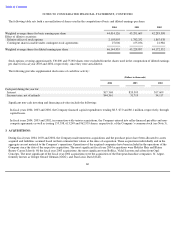
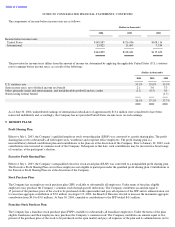
Certain intangible asset amounts set forth above are based on preliminary purchase price allocations associated with recent business
acquisitions, and are subject to finalization and adjustment.
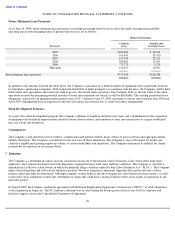
All intangible assets have been assigned an estimated finite useful life, and are amortized on a straight-line basis over the number of years
that approximate their respective useful lives (ranging from four to 30 years). The straight-line method of amortization allocates the cost of
the intangible assets to earnings in proportion to the amount of economic benefits obtained by the Company in that reporting period. Total
amortization expense related to amortizable intangible assets during the years ended June 30, 2004, 2003 and 2002 was approximately $2.9,
$3.0 and $2.3 million, respectively. As of June 30, 2004, future estimated amortization expense related to amortizable intangible assets is
estimated to be:
59
(Dollars in thousands)
2004
2003
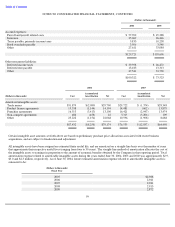
Accrued expenses:
Payroll and payroll related costs
$
57,702
$
45,388
Insurance
35,069
26,446
Taxes payable, primarily income taxes
5,833
10,238
Book overdrafts payable
3,506
3,540
Other
27,611
33,084
$
129,721
$
118,696
Other noncurrent liabilities:
Deferred income taxes
$
39,598
$
26,472
Deferred rent payable
13,183
13,313
Other
47,541
33,738
$
100,322
$
73,523
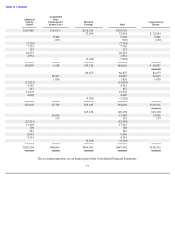
2004
2003
Accumulated
Accumulated
(Dollars in thousands)
Cost
Amortization
Net
Cost
Amortization
Net
Amortized intangible assets:
Trade names
$
31,879
$
(2,089
)
$
29,790
$
29,722
$
(1,374
)
$
28,348
Product license agreements
15,338
(1,144
)
14,194
14,481
(602
)
13,879
Franchise agreements
16,513
(3,413
)
13,100
16,421
(2,947
)
13,474
Non
-
compete agreements
480
(458
)
22
5,315
(5,206
)
109
Other
23,222
(1,154
)
22,068
10,596
(1,908
)
8,688
$
87,432
$
(8,258
)
$
79,174
$
76,535
$
(12,037
)
$
64,498
(Dollars in thousands)
Fiscal Year
2005
$
2,988
2006
2,941
2007
2,941
2008
2,913
2009
2,872