Supercuts 2004 Annual Report Download - page 89
Download and view the complete annual report
Please find page 89 of the 2004 Supercuts annual report below. You can navigate through the pages in the report by either clicking on the pages listed below, or by using the keyword search tool below to find specific information within the annual report.-
 1
1 -
2
-
3
-
4
-
5
-
6
-
7
-
8
-
9
-
10
-
11
-
12
-
13
-
14
-
15
-
16
-
17
-
18
-
19
-
20
-
21
-
22
-
23
-
24
-
25
-
26
-
27
-
28
-
29
-
30
-
31
-
32
-
33
-
34
-
35
-
36
-
37
-
38
-
39
-
40
-
41
-
42
-
43
-
44
-
45
-
46
-
47
-
48
-
49
-
50
-
51
-
52
-
53
-
54
-
55
-
56
-
57
-
58
-
59
-
60
-
61
-
62
-
63
-
64
-
65
-
66
-
67
-
68
-
69
-
70
-
71
-
72
-
73
-
74
-
75
-
76
-
77
-
78
-
 79
79 -
 80
80 -
 81
81 -
 82
82 -
 83
83 -
 84
84 -
 85
85 -
 86
86 -
 87
87 -
 88
88 -
 89
89 -
 90
90 -
 91
91 -
 92
92 -
 93
93 -
 94
94 -
 95
95 -
 96
96 -
 97
97 -
 98
98 -
 99
99 -
100
-
101
-
102
-
103
-
104
-
105
-
106
-
107
-
108
-
109
-
110
-
111
-
112
-
113
-
114
-
115
-
116
-
117
-
118
-
119
-
120
-
121
-
122
-
123
-
124
-
125
-
126
-
127
-
128
-
129
-
130
-
131
-
132
-
133
-
134
-
135
-
136
-
137
-
138
-
139
-
140
-
141
-
142
-
143
-
144
-
145
-
146
-
147
-
148
 |
 |

Table of Contents
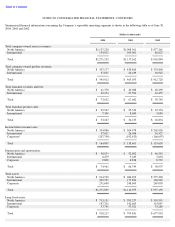
NOTES TO CONSOLIDATED FINANCIAL STATEMENTS, CONTINUED
Summarized financial information concerning the Company’s reportable operating segments is shown in the following table as of June 30,
2004, 2003 and 2002:
(Dollars in thousands)
2004
2003
2002
Total company
-
owned service revenues:
North America
$
1,137,220
$
1,008,561
$
877,261
International
134,012
109,001
86,623
Total
$
1,271,232
$
1,117,562
$
963,884
Total company
-
owned product revenues:
North America
$
507,177
$
438,864
$
393,806
International
37,835
26,189
18,922
Total
$
545,012
$
465,053
$
412,728
Total franchise royalties and fees:
North America
$
41,378
$
40,088
$
40,290
International
32,254
27,594
10,455
Total
$
73,632
$
67,682
$
50,745
Total franchise product sales:
North America
$
25,967
$
25,543
$
23,754
International
7,300
8,690
3,080
Total
$
33,267
$
34,233
$
26,834
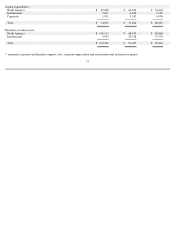
Income before income taxes:
North America
$
334,886
$
304,978
$
265,930
International
37,632
26,046
16,327
Corporate*
(207,709
)
(192,423
)
(166,607
)
Total
$
164,809
$
138,601
$
115,650
Depreciation and amortization:
North America
$
58,674
$
52,692
$
46,542
International
6,479
5,229
3,694
Corporate
9,808
8,828
8,739
Total
$
74,961
$
66,749
$
58,975
Total assets:
North America
$
814,532
$
686,492
$
577,230
International
205,727
177,854
130,922
Corporate
251,600
248,609
249,038
Total
$
1,271,859
$
1,112,955
$
957,190
Long
-
lived assets:
North America
$
713,151
$
593,257
$
510,591
International
147,321
142,663
114,047
Corporate
57,745
57,921
53,280
Total
$
918,217
$
793,841
$
677,918