Supercuts 2004 Annual Report Download - page 45
Download and view the complete annual report
Please find page 45 of the 2004 Supercuts annual report below. You can navigate through the pages in the report by either clicking on the pages listed below, or by using the keyword search tool below to find specific information within the annual report.-
 1
1 -
2
-
3
-
4
-
5
-
6
-
7
-
8
-
9
-
10
-
11
-
12
-
13
-
14
-
15
-
16
-
17
-
18
-
19
-
20
-
21
-
22
-
23
-
24
-
25
-
26
-
27
-
28
-
29
-
30
-
31
-
32
-
33
-
34
-
 35
35 -
 36
36 -
 37
37 -
 38
38 -
 39
39 -
 40
40 -
 41
41 -
 42
42 -
 43
43 -
 44
44 -
 45
45 -
 46
46 -
 47
47 -
 48
48 -
 49
49 -
 50
50 -
 51
51 -
 52
52 -
 53
53 -
 54
54 -
 55
55 -
56
-
57
-
58
-
59
-
60
-
61
-
62
-
63
-
64
-
65
-
66
-
67
-
68
-
69
-
70
-
71
-
72
-
73
-
74
-
75
-
76
-
77
-
78
-
79
-
80
-
81
-
82
-
83
-
84
-
85
-
86
-
87
-
88
-
89
-
90
-
91
-
92
-
93
-
94
-
95
-
96
-
97
-
98
-
99
-
100
-
101
-
102
-
103
-
104
-
105
-
106
-
107
-
108
-
109
-
110
-
111
-
112
-
113
-
114
-
115
-
116
-
117
-
118
-
119
-
120
-
121
-
122
-
123
-
124
-
125
-
126
-
127
-
128
-
129
-
130
-
131
-
132
-
133
-
134
-
135
-
136
-
137
-
138
-
139
-
140
-
141
-
142
-
143
-
144
-
145
-
146
-
147
-
148
 |
 |

Table of Contents
LIQUIDITY AND CAPITAL RESOURCES
Overview
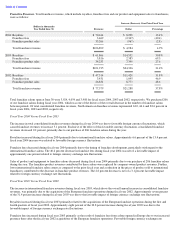
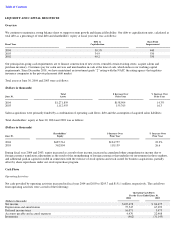
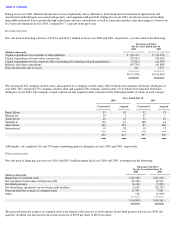
We continue to maintain a strong balance sheet to support system growth and financial flexibility. Our debt to capitalization ratio, calculated as
total debt as a percentage of total debt and shareholders’ equity at fiscal year end, was as follows:
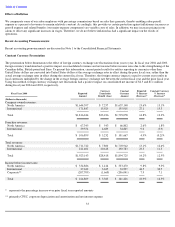
Our principal on-going cash requirements are to finance construction of new stores, remodel certain existing stores, acquire salons and
purchase inventory. Customers pay for salon services and merchandise in cash at the time of sale, which reduces our working capital
requirements. Since December 2001, we have maintained an investment grade “2” rating with the NAIC, the rating agency that regulates
insurance companies in the private placement debt market.
Total assets at June 30, 2004 and 2003 were as follows:
(Dollars in thousands)
Salon acquisitions were primarily funded by a combination of operating cash flows, debt and the assumption of acquired salon liabilities.
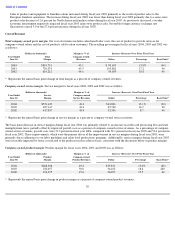
Total shareholders’ equity at June 30, 2004 and 2003 was as follows:
(Dollars in thousands)
During fiscal year 2004 and 2003, equity increased as a result of net income, increased accumulated other comprehensive income due to
foreign currency translation adjustments as the result of the strengthening of foreign currencies that underlie our investments in those markets,
and additional paid-in capital recorded in connection with the exercise of stock options and stock issued for business acquisitions, partially
offset by share repurchases under our stock repurchase program.
Cash Flows
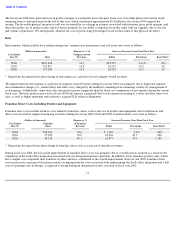
Operating Activities
Net cash provided by operating activities increased in fiscal year 2004 and 2003 to $205.7 and $151.1 million, respectively. The cash flows
from operating activities were a result of the following:
Debt to
Basis Point
Fiscal Year
Capitalization
Improvement
2004
30.5
%
440
2003
34.9
530
2002
40.2
330
Total
$ Increase Over
% Increase Over
June 30,
Assets
Prior Year
Prior Year
2004
$
1,271,859
$
158,904
14.3
%
2003
1,112,955
155,765
16.3
Shareholders
’
$
Increase Over
% Increase Over
June 30,
Equity
Prior Year
Prior Year
2004
$
687,561
$
124,757
22.2
%
2003
562,804
118,139
26.6
Operating Cash Flows
For the Years Ended June 30,
(Dollars in thousands)
2004
2003
Net income
$
105,478
$
86,675
Depreciation and amortization
75,547
67,399
Deferred income taxes
16,071
3,475
Accounts payable and accrued expenses
4,470
22,468
Inventories
(462
)
(31,145
)