Supercuts 2004 Annual Report Download - page 43
Download and view the complete annual report
Please find page 43 of the 2004 Supercuts annual report below. You can navigate through the pages in the report by either clicking on the pages listed below, or by using the keyword search tool below to find specific information within the annual report.-
 1
1 -
2
-
3
-
4
-
5
-
6
-
7
-
8
-
9
-
10
-
11
-
12
-
13
-
14
-
15
-
16
-
17
-
18
-
19
-
20
-
21
-
22
-
23
-
24
-
25
-
26
-
27
-
28
-
29
-
30
-
31
-
32
-
 33
33 -
 34
34 -
 35
35 -
 36
36 -
 37
37 -
 38
38 -
 39
39 -
 40
40 -
 41
41 -
 42
42 -
 43
43 -
 44
44 -
 45
45 -
 46
46 -
 47
47 -
 48
48 -
 49
49 -
 50
50 -
 51
51 -
 52
52 -
 53
53 -
54
-
55
-
56
-
57
-
58
-
59
-
60
-
61
-
62
-
63
-
64
-
65
-
66
-
67
-
68
-
69
-
70
-
71
-
72
-
73
-
74
-
75
-
76
-
77
-
78
-
79
-
80
-
81
-
82
-
83
-
84
-
85
-
86
-
87
-
88
-
89
-
90
-
91
-
92
-
93
-
94
-
95
-
96
-
97
-
98
-
99
-
100
-
101
-
102
-
103
-
104
-
105
-
106
-
107
-
108
-
109
-
110
-
111
-
112
-
113
-
114
-
115
-
116
-
117
-
118
-
119
-
120
-
121
-
122
-
123
-
124
-
125
-
126
-
127
-
128
-
129
-
130
-
131
-
132
-
133
-
134
-
135
-
136
-
137
-
138
-
139
-
140
-
141
-
142
-
143
-
144
-
145
-
146
-
147
-
148
 |
 |

Table of Contents
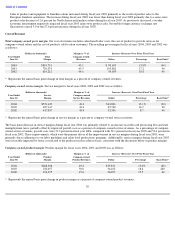
Effects of Inflation
We compensate some of our salon employees with percentage commissions based on sales they generate, thereby enabling salon payroll
expense as a percent of revenues to remain relatively constant. Accordingly, this provides us certain protection against inflationary increases as
payroll expense and related benefits (our major expense components) are variable costs of sales. In addition, we may increase pricing in our
salons to offset any significant increases in wages. Therefore, we do not believe inflation has had a significant impact on the results of
operations.
Recent Accounting Pronouncements
Recent accounting pronouncements are discussed in Note 1 to the Consolidated Financial Statements.
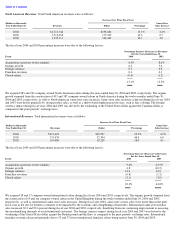
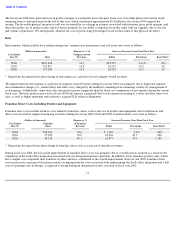
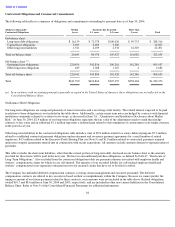
Constant Currency Presentation
The presentation below demonstrates the effect of foreign currency exchange rate fluctuations from year to year. In fiscal year 2004 and 2003,
foreign currency translation had a positive impact on consolidated revenues and net income before income taxes due to the strengthening of the
Canadian dollar, British pound and Euro. To present this information, current period results for entities reporting in currencies other than
United States dollars are converted into United States dollars at the average exchange rates in effect during the prior fiscal year, rather than the
actual average exchange rates in effect during the current fiscal year. Therefore, the foreign currency impact is equal to current year results in
local currencies multiplied by the change in the average foreign currency exchange rate between the current fiscal year and the prior fiscal year.
Using this method, foreign currency exchange rate fluctuations had a positive impact on consolidated net income of $2.5 and $1.1 million
during fiscal year 2004 and 2003, respectively.
33
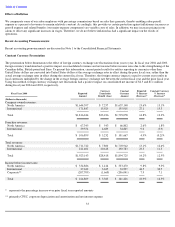
Currency
Constant
Reported
Constant Currency
Fiscal Year 2004
Reported
Translation
Currency
% Increase
% Increase
(Dollars in thousands)
Amount
Benefit (Loss)
Amount
(Decrease)*
(Decrease)*
Company
-
owned revenues:
North America
$
1,644,397
$
7,257
$
1,637,140
13.6
%
13.1
%
International
171,847
15,929
155,918
27.1
15.3
Total
$
1,816,244
$
23,186
$
1,793,058
14.8
%
13.3
%
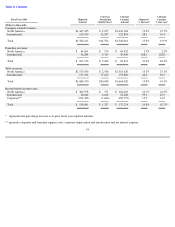
Franchise revenues:
North America
$
67,345
$
543
$
66,802
2.6
%
1.8
%
International
39,554
4,689
34,865
9.0
(3.9
)
Total
$
106,899
$
5,232
$
101,667
4.9
%
(0.2)
%
Total revenues:
North America
$
1,711,742
$
7,800
$
1,703,942
13.1
%
12.6
%
International
211,401
20,618
190,783
23.3
11.3
Total
$
1,923,143
$
28,418
$
1,894,725
14.2
%
12.5
%
Income before income taxes:
North America
$
334,886
$
1,416
$
333,470
9.8
%
9.3
%
International
37,632
3,635
33,997
44.5
30.5
Corporate**
(207,709
)
(1,668
)
(206,041
)
7.9
7.1
Total
$
164,809
$
3,383
$
161,426
18.9
%
16.5
%
*
represents the percentage increase over prior fiscal year reported amounts
**
primarily CFSC, corporate depreciation and amortization and net interest expense