Supercuts 2004 Annual Report Download - page 32
Download and view the complete annual report
Please find page 32 of the 2004 Supercuts annual report below. You can navigate through the pages in the report by either clicking on the pages listed below, or by using the keyword search tool below to find specific information within the annual report.-
 1
1 -
2
-
3
-
4
-
5
-
6
-
7
-
8
-
9
-
10
-
11
-
12
-
13
-
14
-
15
-
16
-
17
-
18
-
19
-
20
-
21
-
 22
22 -
 23
23 -
 24
24 -
 25
25 -
 26
26 -
 27
27 -
 28
28 -
 29
29 -
 30
30 -
 31
31 -
 32
32 -
 33
33 -
 34
34 -
 35
35 -
 36
36 -
 37
37 -
 38
38 -
 39
39 -
 40
40 -
 41
41 -
 42
42 -
43
-
44
-
45
-
46
-
47
-
48
-
49
-
50
-
51
-
52
-
53
-
54
-
55
-
56
-
57
-
58
-
59
-
60
-
61
-
62
-
63
-
64
-
65
-
66
-
67
-
68
-
69
-
70
-
71
-
72
-
73
-
74
-
75
-
76
-
77
-
78
-
79
-
80
-
81
-
82
-
83
-
84
-
85
-
86
-
87
-
88
-
89
-
90
-
91
-
92
-
93
-
94
-
95
-
96
-
97
-
98
-
99
-
100
-
101
-
102
-
103
-
104
-
105
-
106
-
107
-
108
-
109
-
110
-
111
-
112
-
113
-
114
-
115
-
116
-
117
-
118
-
119
-
120
-
121
-
122
-
123
-
124
-
125
-
126
-
127
-
128
-
129
-
130
-
131
-
132
-
133
-
134
-
135
-
136
-
137
-
138
-
139
-
140
-
141
-
142
-
143
-
144
-
145
-
146
-
147
-
148
 |
 |

Table of Contents
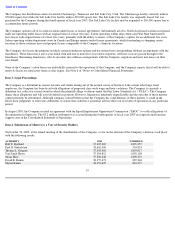
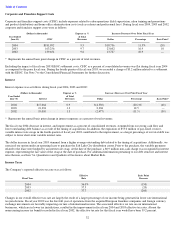
RESULTS OF OPERATIONS
Revenues
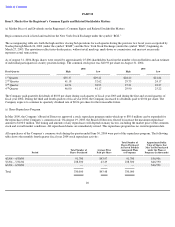
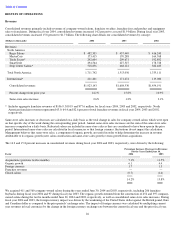
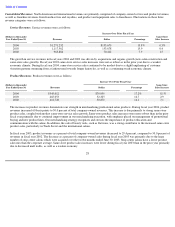
Consolidated revenues primarily include revenues of company-owned salons, franchise royalties, franchise fees and product and equipment
sales to franchisees. During fiscal year 2004, consolidated revenues increased 14.2 percent to a record $1.9 billion. During fiscal year 2003,
consolidated revenues increased 15.8 percent to $1.7 billion. The following chart details our consolidated revenues by concept:
Same-store sales increases or decreases are calculated on a daily basis as the total change in sales for company-owned salons which were open
on that specific day of the week during the corresponding prior period. Annual same-store sales increases are the sum of the same-store sales
increases computed on a daily basis. Relocated salons are included in same-store sales as they are considered to have been open in the prior
period. International same-store sales are calculated in local currencies so that foreign currency fluctuations do not impact the calculation.
Management believes that same-store sales, a component of organic growth, are useful in order to help determine the increase in revenue
attributable to its organic growth (new salon construction and same-store sales growth) versus growth from acquisitions.
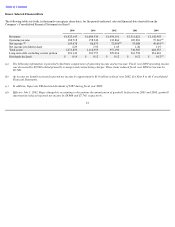
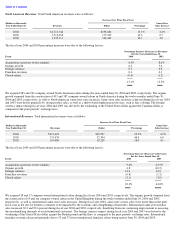
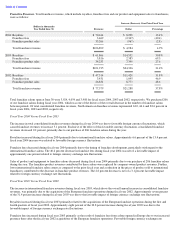
The 14.2 and 15.8 percent increases in consolidated revenues during fiscal year 2004 and 2003, respectively, were driven by the following:
We acquired 411 and 560 company-owned salons during the years ended June 30, 2004 and 2003, respectively, including 206 franchise
buybacks during fiscal year 2004 and 97 during fiscal year 2003. The organic growth stemmed from the construction of 452 and 397 company-
owned salons during the twelve months ended June 30, 2004 and 2003, respectively, as well as consolidated same-store sales increases. During
fiscal year 2004 and 2003, the foreign currency impact was driven by the weakening of the United States dollar against the British pound, Euro
and Canadian dollar as compared to the prior periods’ exchange rates. The impact of foreign currency was calculated by multiplying current
year revenues in local currencies by the change in the foreign currency exchange rate between the current fiscal year and the prior fiscal year.
26
(Dollars in thousands)
2004
2003
2002
Revenues:
North America:
Regis Salons
$
482,303
$
437,449
$
416,240
MasterCuts
173,415
170,288
164,768
Trade Secret*
242,604
209,671
192,892
SmartStyle
294,564
227,527
178,728
Strip Center Salons*
518,856
468,121
382,483
Total North America
1,711,742
1,513,056
1,335,111
International*
211,401
171,474
119,080
Consolidated revenues
$
1,923,143
$
1,684,530
$
1,454,191
Percent change from prior year
14.2
%
15.8
%
10.9
%
Same
-
store sales increase
2.6
%
1.2
%
3.1
%
*
Includes aggregate franchise revenues of $106.9, $101.9 and $77.6 million for fiscal years 2004, 2003 and 2002, respectively. North
American franchise revenues represented 63.0, 64.4 and 82.6 percent of total franchise revenues in fiscal year 2004, 2003 and 2002,
respectively.
Percentage Increase (Decrease) in Revenues
For the Years Ended June 30,
Factor
2004
2003
Acquisitions (previous twelve months)
7.1
%
11.5
%
Organic growth
6.1
4.4
Foreign currency
1.7
1.3
Franchise revenues
—
—
Closed salons
(0.7
)
(1.4
)
14.2
%
15.8
%