Supercuts 2004 Annual Report Download - page 28
Download and view the complete annual report
Please find page 28 of the 2004 Supercuts annual report below. You can navigate through the pages in the report by either clicking on the pages listed below, or by using the keyword search tool below to find specific information within the annual report.-
 1
1 -
2
-
3
-
4
-
5
-
6
-
7
-
8
-
9
-
10
-
11
-
12
-
13
-
14
-
15
-
16
-
17
-
 18
18 -
 19
19 -
 20
20 -
 21
21 -
 22
22 -
 23
23 -
 24
24 -
 25
25 -
 26
26 -
 27
27 -
 28
28 -
 29
29 -
 30
30 -
 31
31 -
 32
32 -
 33
33 -
 34
34 -
 35
35 -
 36
36 -
 37
37 -
 38
38 -
39
-
40
-
41
-
42
-
43
-
44
-
45
-
46
-
47
-
48
-
49
-
50
-
51
-
52
-
53
-
54
-
55
-
56
-
57
-
58
-
59
-
60
-
61
-
62
-
63
-
64
-
65
-
66
-
67
-
68
-
69
-
70
-
71
-
72
-
73
-
74
-
75
-
76
-
77
-
78
-
79
-
80
-
81
-
82
-
83
-
84
-
85
-
86
-
87
-
88
-
89
-
90
-
91
-
92
-
93
-
94
-
95
-
96
-
97
-
98
-
99
-
100
-
101
-
102
-
103
-
104
-
105
-
106
-
107
-
108
-
109
-
110
-
111
-
112
-
113
-
114
-
115
-
116
-
117
-
118
-
119
-
120
-
121
-
122
-
123
-
124
-
125
-
126
-
127
-
128
-
129
-
130
-
131
-
132
-
133
-
134
-
135
-
136
-
137
-
138
-
139
-
140
-
141
-
142
-
143
-
144
-
145
-
146
-
147
-
148
 |
 |

Table of Contents
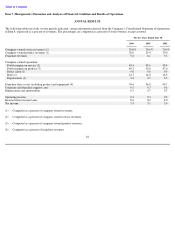
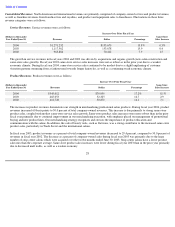
Item 7. Management’s Discussion and Analysis of Financial Condition and Results of Operations
ANNUAL RESULTS
The following table sets forth, for the periods indicated, certain information derived from the Company’
s Consolidated Statement of Operations
in Item 8. expressed as a percent of revenues. The percentages are computed as a percent of total revenues, except as noted.
22
For the Years Ended June 30,
2004
2003
2002
Company
-
owned service revenues (1)
70.0
%
70.6
%
70.0
%
Company
-
owned product revenues (1)
30.0
29.4
30.0
Franchise revenues
5.6
6.1
5.3
Company
-
owned operations:
Profit margins on service (2)
43.4
43.6
43.4
Profit margins on product (3)
49.2
50.0
47.6
Direct salon (1)
9.0
9.0
9.0
Rent (1)
14.7
14.8
14.3
Depreciation (1)
3.4
3.5
3.5
Franchise direct costs, including product and equipment (4)
54.6
56.0
49.1
Corporate and franchise support costs
9.5
9.7
9.6
Depreciation and amortization
0.7
0.7
0.7
Operating income
9.4
9.4
9.2
Income before income taxes
8.6
8.2
8.0
Net income
5.5
5.1
5.0
(1)
Computed as a percent of company
-
owned revenues.
(2)
Computed as a percent of company
-
owned service revenues.
(3)
Computed as a percent of company
-
owned product revenues.
(4)
Computed as a percent of franchise revenues.