Supercuts 2004 Annual Report Download - page 41
Download and view the complete annual report
Please find page 41 of the 2004 Supercuts annual report below. You can navigate through the pages in the report by either clicking on the pages listed below, or by using the keyword search tool below to find specific information within the annual report.-
 1
1 -
2
-
3
-
4
-
5
-
6
-
7
-
8
-
9
-
10
-
11
-
12
-
13
-
14
-
15
-
16
-
17
-
18
-
19
-
20
-
21
-
22
-
23
-
24
-
25
-
26
-
27
-
28
-
29
-
30
-
 31
31 -
 32
32 -
 33
33 -
 34
34 -
 35
35 -
 36
36 -
 37
37 -
 38
38 -
 39
39 -
 40
40 -
 41
41 -
 42
42 -
 43
43 -
 44
44 -
 45
45 -
 46
46 -
 47
47 -
 48
48 -
 49
49 -
 50
50 -
 51
51 -
52
-
53
-
54
-
55
-
56
-
57
-
58
-
59
-
60
-
61
-
62
-
63
-
64
-
65
-
66
-
67
-
68
-
69
-
70
-
71
-
72
-
73
-
74
-
75
-
76
-
77
-
78
-
79
-
80
-
81
-
82
-
83
-
84
-
85
-
86
-
87
-
88
-
89
-
90
-
91
-
92
-
93
-
94
-
95
-
96
-
97
-
98
-
99
-
100
-
101
-
102
-
103
-
104
-
105
-
106
-
107
-
108
-
109
-
110
-
111
-
112
-
113
-
114
-
115
-
116
-
117
-
118
-
119
-
120
-
121
-
122
-
123
-
124
-
125
-
126
-
127
-
128
-
129
-
130
-
131
-
132
-
133
-
134
-
135
-
136
-
137
-
138
-
139
-
140
-
141
-
142
-
143
-
144
-
145
-
146
-
147
-
148
 |
 |

Table of Contents
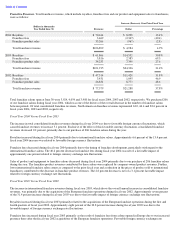
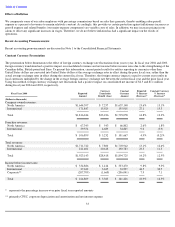
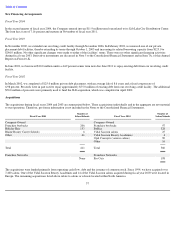
Corporate and Franchise Support Costs
Corporate and franchise support costs (CFSC) include expenses related to salon operations (field supervision, salon training and promotions
and product distribution) and home office administration costs (such as salaries and professional fees). During fiscal year 2004, 2003 and 2002,
corporate and franchise support costs were as follows:
Excluding the impact of fiscal year 2003 EEOC settlement costs, CFSC as a percent of consolidated revenues was flat during fiscal year 2004
as compared to the prior fiscal year. During the fourth quarter of fiscal year 2003, we recorded a charge of $3.2 million related to a settlement
with the EEOC. See Note 7 to the Consolidated Financial Statements for further discussion.
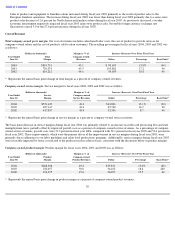
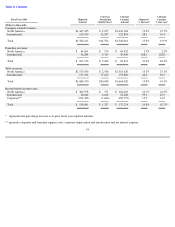
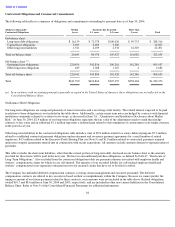
Interest
Interest expense was as follows during fiscal year 2004, 2003 and 2002:
The fiscal year 2004 decrease in interest, and improvement as a percent of consolidated revenues, stemmed from our strong cash flow and
lower outstanding debt balance as a result of the timing of acquisitions. In addition, the expiration of $55.0 million of pay-fixed, receive-
variable interest rate swaps in the fourth quarter of fiscal year 2003 contributed to the improvement, as a larger percentage of our total debt was
subject to lower short-term variable interest rates.
The dollar increase in fiscal year 2003 stemmed from a higher average outstanding debt related to the timing of acquisitions. Additionally, we
exercised our option under an operating lease to purchase the Salt Lake City distribution center. Prior to the purchase, the variable payments
related to the lease were hedged by an interest rate swap. At the date of the purchase, a $0.9 million non-cash charge was recognized in interest
expense, representing the fair value of the swap at the date of purchase. For additional information pertaining to our debt structure and interest
rates thereon, see Item 7A. Quantitative and Qualitative Disclosures about Market Risk.
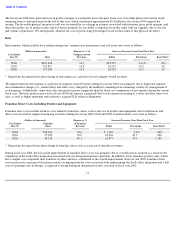
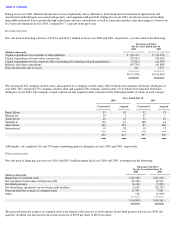
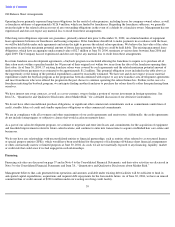
Income Taxes
The Company’s reported effective tax rate was as follows:
Changes in our overall effective tax rate are largely the result of a larger percentage of our income being generated in lower rate international
tax jurisdictions. Fiscal year 2003 was the first full year of operations from the acquired European franchise companies and foreign currency
exchange movements are favorably impacting our mix of international income. The associated effective tax rate on our international
businesses, which are in lower tax jurisdictions, resulted in the improvement in fiscal year 2004 and 2003 effective tax rates. Absent the
nonrecurring income tax benefit recorded in fiscal year 2002, the effective tax rate for that fiscal year would have been 39.2 percent.
32
(Dollars in thousands)
Expense as %
Increase (Decrease) Over Prior Fiscal Year
Year Ended
of Total
June 30,
CFSC
Revenues
Dollar
Percentage
Basis Point*
2004
$
181,992
9.5
$
18,736
11.5
%
(20
)
2003
163,256
9.7
23,602
16.9
10
2002
139,654
9.6
13,727
10.9
—
*
Represents the annual basis point change in CFSC as a percent of total revenues.
(Dollars in thousands)
Expense as %
Increase (Decrease) Over Prior Fiscal Year
Year Ended
of Total
June 30,
Interest
Revenues
Dollar
Percentage
Basis Point*
2004
$
17,064
0.9
$
(4,330
)
(20.2
)%
(40
)
2003
21,394
1.3
2,384
12.5
—
2002
19,010
1.3
(2,477
)
(11.5
)
(30
)
*
Represents the annual basis point change in interest expenses as a percent of total revenues.
Effective
Basis Point
Fiscal Year
Rate
Decrease
2004
36.0
%
(150
)
2003
37.5
(20
)
2002
37.7
(260
)