Supercuts 2004 Annual Report Download - page 61
Download and view the complete annual report
Please find page 61 of the 2004 Supercuts annual report below. You can navigate through the pages in the report by either clicking on the pages listed below, or by using the keyword search tool below to find specific information within the annual report.-
 1
1 -
2
-
3
-
4
-
5
-
6
-
7
-
8
-
9
-
10
-
11
-
12
-
13
-
14
-
15
-
16
-
17
-
18
-
19
-
20
-
21
-
22
-
23
-
24
-
25
-
26
-
27
-
28
-
29
-
30
-
31
-
32
-
33
-
34
-
35
-
36
-
37
-
38
-
39
-
40
-
41
-
42
-
43
-
44
-
45
-
46
-
47
-
48
-
49
-
50
-
 51
51 -
 52
52 -
 53
53 -
 54
54 -
 55
55 -
 56
56 -
 57
57 -
 58
58 -
 59
59 -
 60
60 -
 61
61 -
 62
62 -
 63
63 -
 64
64 -
 65
65 -
 66
66 -
 67
67 -
 68
68 -
 69
69 -
 70
70 -
 71
71 -
72
-
73
-
74
-
75
-
76
-
77
-
78
-
79
-
80
-
81
-
82
-
83
-
84
-
85
-
86
-
87
-
88
-
89
-
90
-
91
-
92
-
93
-
94
-
95
-
96
-
97
-
98
-
99
-
100
-
101
-
102
-
103
-
104
-
105
-
106
-
107
-
108
-
109
-
110
-
111
-
112
-
113
-
114
-
115
-
116
-
117
-
118
-
119
-
120
-
121
-
122
-
123
-
124
-
125
-
126
-
127
-
128
-
129
-
130
-
131
-
132
-
133
-
134
-
135
-
136
-
137
-
138
-
139
-
140
-
141
-
142
-
143
-
144
-
145
-
146
-
147
-
148
 |
 |

Table of Contents
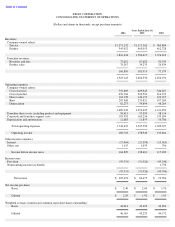
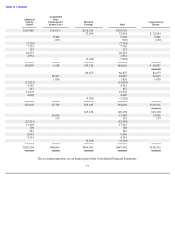
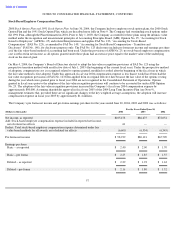
REGIS CORPORATION
CONSOLIDATED STATEMENT OF OPERATIONS
(Dollars and shares in thousands, except per share amounts)
Years Ended June 30,
2004
2003
2002
Revenues:
Company
-
owned salons:
Service
$
1,271,232
$
1,117,562
$
963,884
Product
545,012
465,053
412,728
1,816,244
1,582,615
1,376,612
Franchise revenues:
Royalties and fees
73,632
67,682
50,745
Product sales
33,267
34,233
26,834
106,899
101,915
77,579
1,923,143
1,684,530
1,454,191
Operating expenses:
Company
-
owned salons:
Cost of service
719,809
629,945
546,027
Cost of product
276,704
232,596
216,373
Direct salon
163,178
142,173
123,915
Rent
267,368
233,821
197,269
Depreciation
62,273
54,894
48,269
1,489,332
1,293,429
1,131,853
Franchise direct costs, including product and equipment
58,413
57,050
38,114
Corporate and franchise support costs
181,992
163,256
139,654
Depreciation and amortization
12,688
11,855
10,706
Total operating expenses
1,742,425
1,525,590
1,320,327
Operating income
180,718
158,940
133,864
Other income (expense):
Interest
(17,064
)
(21,394
)
(19,010
)
Other, net
1,155
1,055
796
Income before income taxes
164,809
138,601
115,650
Income taxes:
Provision
(59,331
)
(51,926
)
(45,346
)
Nonrecurring income tax benefit
1,750
(59,331
)
(51,926
)
(43,596
)
Net income
$
105,478
$
86,675
$
72,054
Net income per share:
Basic
$
2.40
$
2.00
$
1.70
Diluted
$
2.29
$
1.92
$
1.63
Weighted average common and common equivalent shares outstanding:
Basic
44,014
43,292
42,283
Diluted
46,145
45,229
44,172