Supercuts 2004 Annual Report Download - page 34
Download and view the complete annual report
Please find page 34 of the 2004 Supercuts annual report below. You can navigate through the pages in the report by either clicking on the pages listed below, or by using the keyword search tool below to find specific information within the annual report.-
 1
1 -
2
-
3
-
4
-
5
-
6
-
7
-
8
-
9
-
10
-
11
-
12
-
13
-
14
-
15
-
16
-
17
-
18
-
19
-
20
-
21
-
22
-
23
-
 24
24 -
 25
25 -
 26
26 -
 27
27 -
 28
28 -
 29
29 -
 30
30 -
 31
31 -
 32
32 -
 33
33 -
 34
34 -
 35
35 -
 36
36 -
 37
37 -
 38
38 -
 39
39 -
 40
40 -
 41
41 -
 42
42 -
 43
43 -
 44
44 -
45
-
46
-
47
-
48
-
49
-
50
-
51
-
52
-
53
-
54
-
55
-
56
-
57
-
58
-
59
-
60
-
61
-
62
-
63
-
64
-
65
-
66
-
67
-
68
-
69
-
70
-
71
-
72
-
73
-
74
-
75
-
76
-
77
-
78
-
79
-
80
-
81
-
82
-
83
-
84
-
85
-
86
-
87
-
88
-
89
-
90
-
91
-
92
-
93
-
94
-
95
-
96
-
97
-
98
-
99
-
100
-
101
-
102
-
103
-
104
-
105
-
106
-
107
-
108
-
109
-
110
-
111
-
112
-
113
-
114
-
115
-
116
-
117
-
118
-
119
-
120
-
121
-
122
-
123
-
124
-
125
-
126
-
127
-
128
-
129
-
130
-
131
-
132
-
133
-
134
-
135
-
136
-
137
-
138
-
139
-
140
-
141
-
142
-
143
-
144
-
145
-
146
-
147
-
148
 |
 |

Table of Contents
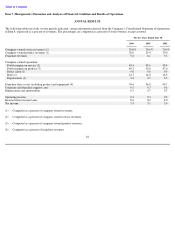
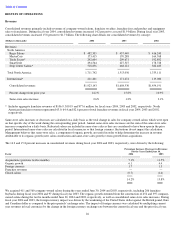
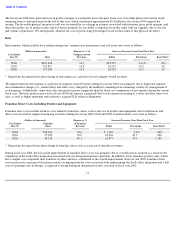
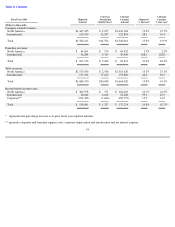
North American Revenues.
Total North American revenues were as follows:
The fiscal year 2004 and 2003 percentage increases were due to the following factors:
We acquired 383 and 543 company-owned North American salons during the years ended June 30, 2004 and 2003, respectively. The organic
growth stemmed from the construction of 433 and 387 company-owned salons in North America during the twelve months ended June 30,
2004 and 2003, respectively, as well as North American same-store sales increases. Same-
store sales increases achieved during fiscal year 2004
and 2003 were driven primarily by strong product sales, as well as a shift towards higher priced services, such as hair coloring. The foreign
currency impact during fiscal years 2004 and 2003 was driven by the weakening of the United States dollar against the Canadian dollar as
compared to the prior periods’ exchange rates.
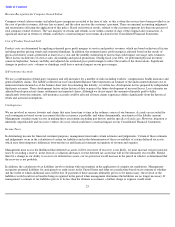
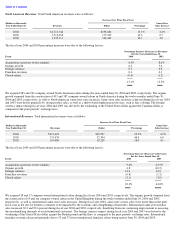
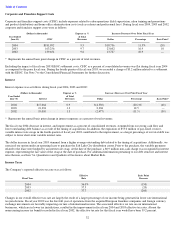
International Revenues.
Total international revenues were as follows:
The fiscal year 2004 and 2003 percentage increases were due to the following factors:
We acquired 28 and 17 company-
owned international salons during fiscal year 2004 and 2003, respectively. The organic growth stemmed from
the construction of 19 and ten company-owned salons in the United Kingdom during the twelve months ended June 30, 2004 and 2003,
respectively, as well as international same-store sales increases. During fiscal year 2004, same-store service sales were lower than in the prior
fiscal year as the service business continues to be impacted by the economy and a lengthening of hairstyles. International same-store product
sales increased 30.2 and 23.6 percent during fiscal year 2004 and 2003, respectively, benefiting from our continuing improvement in assessing
the merchandising demands of our international customers. The foreign currency impact during fiscal year 2004 and 2003 was driven by the
weakening of the United States dollar against the British pound and the Euro as compared to the prior periods’ exchange rates. International
franchise revenues decreased primarily due to 33 and 57 fewer international franchise salons being open at June 30, 2004 and 2003,
(Dollars in thousands)
Increase Over Prior Fiscal Year
Same-Store
Year Ended June 30,
Revenues
Dollar
Percentage
Sales Increase
2004
$
1,711,742
$
198,686
13.1
%
2.2
%
2003
1,513,056
177,945
13.3
0.7
2002
1,335,111
124,442
10.3
3.0
Percentage Increase (Decrease) in Revenues
For the Years Ended June 30,
Factor
2004
2003
Acquisitions (previous twelve months)
6.9
%
8.6
%
Organic growth
6.2
5.6
Foreign currency
0.5
0.2
Franchise revenues
0.1
0.1
Closed salons
(0.6
)
(1.2
)
13.1
%
13.3
%
(Dollars in thousands)
Increase Over Prior Fiscal Year
Same
-
Store
Year Ended June 30,
Revenues
Dollar
Percentage
Sales Increase
2004
$
211,401
$
39,927
23.3
%
4.9
%
2003
171,474
52,394
44.0
6.0
2002
119,080
18,128
18.0
4.1
Percentage Increase (Decrease) in Revenues
For the Years Ended June 30,
Factor
2004
2003
Acquisitions (previous twelve months)
9.4
%
43.9
%
Organic growth
4.8
(10.5
)
Foreign currency
12.0
14.8
Franchise revenues
(0.8
)
(1.2
)
Closed salons
(2.1
)
(3.0
)
23.3
%
44.0
%