Neiman Marcus 2012 Annual Report Download - page 65
Download and view the complete annual report
Please find page 65 of the 2012 Neiman Marcus annual report below. You can navigate through the pages in the report by either clicking on the pages listed below, or by using the keyword search tool below to find specific information within the annual report.-
 1
1 -
2
-
3
-
4
-
5
-
6
-
7
-
8
-
9
-
10
-
11
-
12
-
13
-
14
-
15
-
16
-
17
-
18
-
19
-
20
-
21
-
22
-
23
-
24
-
25
-
26
-
27
-
28
-
29
-
30
-
31
-
32
-
33
-
34
-
35
-
36
-
37
-
38
-
39
-
40
-
41
-
42
-
43
-
44
-
45
-
46
-
47
-
48
-
49
-
50
-
51
-
52
-
53
-
54
-
 55
55 -
 56
56 -
 57
57 -
 58
58 -
 59
59 -
 60
60 -
 61
61 -
 62
62 -
 63
63 -
 64
64 -
 65
65 -
 66
66 -
 67
67 -
 68
68 -
 69
69 -
 70
70 -
 71
71 -
 72
72 -
 73
73 -
 74
74 -
 75
75 -
76
-
77
-
78
-
79
-
80
-
81
-
82
-
83
-
84
-
85
-
86
-
87
-
88
-
89
-
90
-
91
-
92
-
93
-
94
-
95
-
96
-
97
-
98
-
99
-
100
-
101
-
102
-
103
-
104
-
105
-
106
-
107
-
108
-
109
-
110
-
111
-
112
-
113
-
114
-
115
-
116
-
117
-
118
-
119
-
120
-
121
-
122
-
123
-
124
-
125
-
126
-
127
-
128
-
129
-
130
-
131
-
132
-
133
-
134
-
135
-
136
-
137
-
138
-
139
-
140
-
141
-
142
-
143
-
144
-
145
-
146
-
147
-
148
-
149
-
150
-
151
-
152
-
153
-
154
-
155
-
156
-
157
-
158
-
159
-
160
-
161
-
162
-
163
-
164
-
165
-
166
-
167
-
168
-
169
-
170
-
171
-
172
-
173
-
174
-
175
-
176
-
177
 |
 |

Table of Contents
Assumptions used in calculating the fiscal year 2013 amounts are described under the caption Stock-Based Compensation in Note 12 of the Notes to Consolidated Financial
Statements beginning on page F-31. These amounts reflect the grant date fair value and do not represent the actual value that may be realized by the named executive officers.
(4) The amounts reported in the Non-Equity Incentive Plan Compensation column reflect the actual amounts earned under the performance-based annual cash incentive
compensation plan described in the “Compensation Discussion and Analysis” section beginning on page 53.
(5) The amounts in this column represent the earnings of Ms. Katz and Mr. Skinner in the Key Employee Deferred Compensation Plan that were in excess of 120% of the federal
long term rate for the periods August 1, 2012 through September 30, 2012, October 1, 2012 through December 31, 2012, and January 1, 2013 through March 31, 2013.
The amounts representing the change in the actuarial value of the named executive officers’ benefits under our retirement and supplemental executive retirement plans from
July 28, 2012 to August 3, 2013 decreased $536,000 for Ms. Katz, $65,000 for Mr. Skinner, and $134,000 for Mr. Gold. This “change in the actuarial value” is the
difference between the fiscal year 2012 and fiscal year 2013 present value of the pension benefits accumulated as of year-end by the named executive officers, assuming that
benefit is not paid until age 65. These amounts were computed using the same assumptions used for financial statement reporting purposes under ASC Subtopic 715-30,
“Defined Benefit Plans — Pension” as described in Note 10 of the Notes to Consolidated Financial Statements beginning on page F-25.
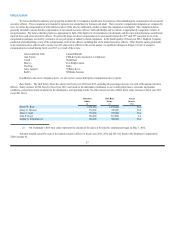
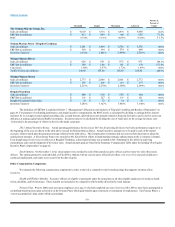
(6) Includes all items listed in the following table entitled “All Other Compensation.” The value of perquisites and other personal benefits is provided in this column and in the
footnotes below even if the amount is less than the reporting threshold established by the SEC.
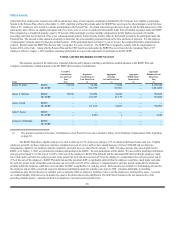
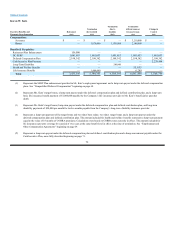
The table below sets forth all other compensation for each of the named executive officers.
All Other Compensation
Karen W.
Katz
($)
James E.
Skinner
($)
James J.
Gold
($)
John E.
Koryl
($)
Joshua G.
Schulman
($)
401(k) plan contributions paid by us $11,047 $10,885 $7,996 $22,725 $5,919
Deferred compensation plan match 74,544 36,894 — — —
DC SERP contributions paid by us 516,399 191,327 171,819 4,240 —
Group term life insurance 2,928 3,898 1,492 816 816
Financial counseling/tax preparation 2,375 5,000 — — —
Long-term disability 1,480 1,480 1,480 1,480 1,480
Transition benefit(1) 7,500 — — — —
New York travel reimbursement(2) 23,866 — — — —
Gross-ups for New York non-resident taxes(3) 78,929 7,344 50,348 — —
TOTALS $719,068 $256,828 $233,135 $29,261 $8,215
(1) Transition benefit paid to highly compensated and grandfathered employees or “Rule of 65” employees as a result of the freeze of the SERP Plan,
more fully described on page 60.
(2) Includes an annual payment of $15,000 in lieu of reimbursement for New York accommodations paid pursuant to the amendment to Ms. Katz’s
employment contract, more fully described beginning on page 69. The amendment also includes a gross-up provision for the payment of income taxes
incurred pursuant to such annual payment.
(3) The amounts shown represent gross-up payments made in connection with New York non-resident taxes.
63