Neiman Marcus 2012 Annual Report Download - page 35
Download and view the complete annual report
Please find page 35 of the 2012 Neiman Marcus annual report below. You can navigate through the pages in the report by either clicking on the pages listed below, or by using the keyword search tool below to find specific information within the annual report.-
 1
1 -
2
-
3
-
4
-
5
-
6
-
7
-
8
-
9
-
10
-
11
-
12
-
13
-
14
-
15
-
16
-
17
-
18
-
19
-
20
-
21
-
22
-
23
-
24
-
 25
25 -
 26
26 -
 27
27 -
 28
28 -
 29
29 -
 30
30 -
 31
31 -
 32
32 -
 33
33 -
 34
34 -
 35
35 -
 36
36 -
 37
37 -
 38
38 -
 39
39 -
 40
40 -
 41
41 -
 42
42 -
 43
43 -
 44
44 -
 45
45 -
46
-
47
-
48
-
49
-
50
-
51
-
52
-
53
-
54
-
55
-
56
-
57
-
58
-
59
-
60
-
61
-
62
-
63
-
64
-
65
-
66
-
67
-
68
-
69
-
70
-
71
-
72
-
73
-
74
-
75
-
76
-
77
-
78
-
79
-
80
-
81
-
82
-
83
-
84
-
85
-
86
-
87
-
88
-
89
-
90
-
91
-
92
-
93
-
94
-
95
-
96
-
97
-
98
-
99
-
100
-
101
-
102
-
103
-
104
-
105
-
106
-
107
-
108
-
109
-
110
-
111
-
112
-
113
-
114
-
115
-
116
-
117
-
118
-
119
-
120
-
121
-
122
-
123
-
124
-
125
-
126
-
127
-
128
-
129
-
130
-
131
-
132
-
133
-
134
-
135
-
136
-
137
-
138
-
139
-
140
-
141
-
142
-
143
-
144
-
145
-
146
-
147
-
148
-
149
-
150
-
151
-
152
-
153
-
154
-
155
-
156
-
157
-
158
-
159
-
160
-
161
-
162
-
163
-
164
-
165
-
166
-
167
-
168
-
169
-
170
-
171
-
172
-
173
-
174
-
175
-
176
-
177
 |
 |

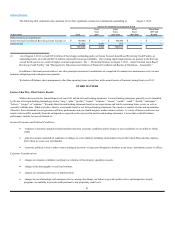
Table of Contents
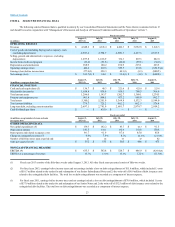
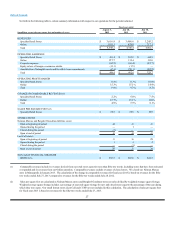
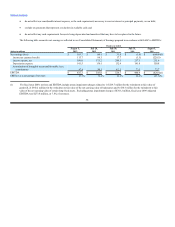
Fiscal year ended
August 3, July 28,
(in thousands) 2013 2012
Asset-Based Revolving Credit Facility $ 1,453 $ 1,052
Senior Secured Term Loan Facility 108,489 98,989
2028 Debentures 9,004 8,906
Senior Subordinated Notes 19,031 51,873
Amortization of debt issue costs 8,404 8,457
Other, net 7,214 7,040
Capitalized interest (237)(1,080)
$153,358 $175,237
Loss on debt extinguishment 15,597 —
Interest expense, net $168,955 $175,237
Income tax expense. Our effective income tax rate for fiscal year 2013 was 41.0% compared to 38.7% for fiscal year 2012. Our effective income
tax rates exceeded the federal statutory rate primarily due to:
· state income taxes; and
· the lack of a U.S. tax benefit related to the losses from our investment in a foreign e-commerce retailer in fiscal year 2013.
We file income tax returns in the U.S. federal jurisdiction and various state and local jurisdictions. During the second quarter of fiscal year 2013, the
Internal Revenue Service (IRS) began its audit of our fiscal year 2010 and 2011 income tax returns and closed its audit of our fiscal year 2008 and 2009
income tax returns. With respect to state and local jurisdictions, with limited exceptions, the Company and its subsidiaries are no longer subject to income tax
audits for fiscal years before 2008. We believe our recorded tax liabilities as of August 3, 2013 are sufficient to cover any potential assessments to be made by
the IRS or other taxing authorities upon the completion of their examinations and we will continue to review our recorded tax liabilities for potential audit
assessments based upon subsequent events, new information and future circumstances. We believe it is reasonably possible that additional adjustments in the
amounts of our unrecognized tax benefits could occur within the next twelve months as a result of settlements with tax authorities or expiration of statutes of
limitation. At this time, we do not believe such adjustments will have a material impact on our Consolidated Financial Statements.
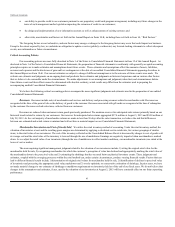
Fiscal Year Ended July 28, 2012 Compared to Fiscal Year Ended July 30, 2011
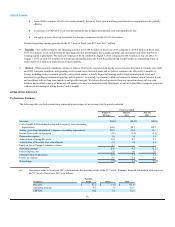
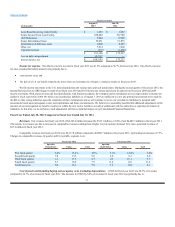
Revenues. Our revenues for fiscal year 2012 of $4,345.4 million increased by $343.1 million, or 8.6%, from $4,002.3 million in fiscal year 2011.
The increase in revenues was due to increases in comparable revenues resulting from a higher level of customer demand. New stores generated revenues of
$27.6 million in fiscal year 2012.
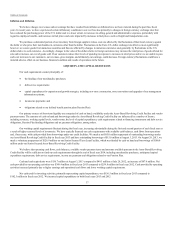
Comparable revenues for fiscal year 2012 were $4,317.8 million compared to $4,000.7 million in fiscal year 2011, representing an increase of 7.9%.
Changes in comparable revenues, by quarter and by reportable segment, were:
Fiscal year 2012 Fiscal year 2011
Specialty Specialty
Retail Stores Online Total Retail Stores Online Total
First fiscal quarter 6.4%15.2%8.0%5.1%12.8%6.4%
Second fiscal quarter 7.8 13.5 9.0 6.0 6.3 6.0
Third fiscal quarter 4.3 17.5 6.7 8.3 16.1 9.7
Fourth fiscal quarter 5.3 18.8 7.9 11.0 11.0 11.0
Total fiscal year 6.0 16.1 7.9 7.5 11.0 8.1
Cost of goods sold including buying and occupancy costs (excluding depreciation). COGS for fiscal year 2012 was 64.3% of revenues
compared to 64.7% of revenues for fiscal year 2011. The decrease in COGS by 0.4% of revenues for fiscal year 2012 was primarily due to:
33