Neiman Marcus 2012 Annual Report Download - page 27
Download and view the complete annual report
Please find page 27 of the 2012 Neiman Marcus annual report below. You can navigate through the pages in the report by either clicking on the pages listed below, or by using the keyword search tool below to find specific information within the annual report.-
 1
1 -
2
-
3
-
4
-
5
-
6
-
7
-
8
-
9
-
10
-
11
-
12
-
13
-
14
-
15
-
16
-
 17
17 -
 18
18 -
 19
19 -
 20
20 -
 21
21 -
 22
22 -
 23
23 -
 24
24 -
 25
25 -
 26
26 -
 27
27 -
 28
28 -
 29
29 -
 30
30 -
 31
31 -
 32
32 -
 33
33 -
 34
34 -
 35
35 -
 36
36 -
 37
37 -
38
-
39
-
40
-
41
-
42
-
43
-
44
-
45
-
46
-
47
-
48
-
49
-
50
-
51
-
52
-
53
-
54
-
55
-
56
-
57
-
58
-
59
-
60
-
61
-
62
-
63
-
64
-
65
-
66
-
67
-
68
-
69
-
70
-
71
-
72
-
73
-
74
-
75
-
76
-
77
-
78
-
79
-
80
-
81
-
82
-
83
-
84
-
85
-
86
-
87
-
88
-
89
-
90
-
91
-
92
-
93
-
94
-
95
-
96
-
97
-
98
-
99
-
100
-
101
-
102
-
103
-
104
-
105
-
106
-
107
-
108
-
109
-
110
-
111
-
112
-
113
-
114
-
115
-
116
-
117
-
118
-
119
-
120
-
121
-
122
-
123
-
124
-
125
-
126
-
127
-
128
-
129
-
130
-
131
-
132
-
133
-
134
-
135
-
136
-
137
-
138
-
139
-
140
-
141
-
142
-
143
-
144
-
145
-
146
-
147
-
148
-
149
-
150
-
151
-
152
-
153
-
154
-
155
-
156
-
157
-
158
-
159
-
160
-
161
-
162
-
163
-
164
-
165
-
166
-
167
-
168
-
169
-
170
-
171
-
172
-
173
-
174
-
175
-
176
-
177
 |
 |

Table of Contents
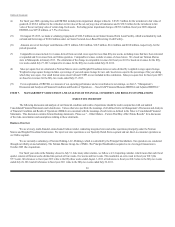
On September 9, 2013, we entered into an Agreement and Plan of Merger (the Merger Agreement) with NM Mariposa Holdings, Inc. and Mariposa
Merger Sub LLC, both of which are owned by an investment group consisting of investment funds affiliated with Ares Management LLC and Canada
Pension Plan Investment Board (collectively, our Future Sponsors). Under the Merger Agreement, we will be acquired for a purchase price based on a total
enterprise value of $6.0 billion (the Future Sponsors’ Acquisition). A portion of the purchase price will be used at closing to repay all amounts outstanding
under our existing senior secured credit facilities. The currently outstanding 7.125% Senior Debentures due 2028 are expected to remain outstanding
immediately following the closing of the transaction in accordance with the terms of the indenture governing such debentures. Consummation of the merger is
subject to various conditions, including (i) the absence of a material adverse effect on the Company, as defined in the Merger Agreement, (ii) the expiration or
termination of any applicable waiting period under the U.S. Hart-Scott-Rodino Antitrust Improvements Act of 1976 (which has now occurred) and (iii) the
completion of the marketing period related to financing of the Future Sponsors’ Acquisition as provided for under the Merger Agreement. We currently
anticipate the closing date for the Future Sponsors’ Acquisition to occur in October or November 2013.
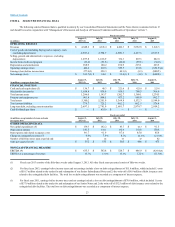
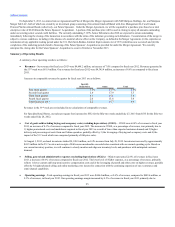
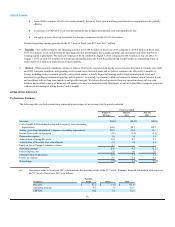
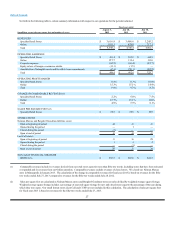
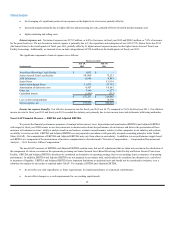
Summary of Operating Results
A summary of our operating results is as follows:
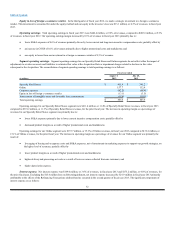
· Revenues - Our revenues for fiscal year 2013 were $4,648.2 million, an increase of 7.0% compared to fiscal year 2012. Revenues generated in
the 53 week were $61.9 million. Our revenues for fiscal year 2012 were $4,345.4 million, an increase of 8.6% as compared to fiscal year
2011.
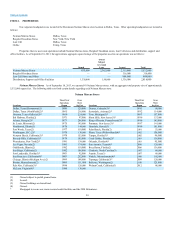
Increases in comparable revenues by quarter for fiscal year 2013 are as follows:
Specialty
Retail Stores Online Total
First fiscal quarter 3.5%13.5%5.4%
Second fiscal quarter 2.0 17.9 5.3
Third fiscal quarter 0.7 15.1 3.6
Fourth fiscal quarter 2.6 15.6 5.4
Total fiscal year 2013 2.2 15.7 4.9
Revenues in the 53 week are not included in our calculations of comparable revenues.
For Specialty Retail Stores, our sales per square foot increased to $552 for the fifty-two weeks ended July 27, 2013 from $535 for the fifty-two
weeks ended July 28, 2012.
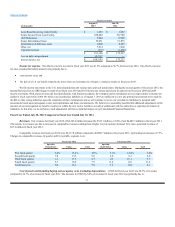
· Cost of goods sold including buying and occupancy costs (excluding depreciation) (COGS) - COGS were 64.4% of revenues in fiscal year
2013, an increase of 0.1% of revenues compared to fiscal year 2012. The increase in COGS, as a percentage of revenues, was primarily due to
1) higher promotional costs and markdowns required in fiscal year 2013 as a result of lower than expected customer demand and 2) higher
delivery and processing net costs from our Online operation, partially offset by 3) the leveraging of buying and occupancy costs and 4) the
impact of the 53 week which was comprised primarily of full-price sales.
At August 3, 2013, on-hand inventories totaled $1,018.8 million, an 8.4% increase from July 28, 2012. Inventories increased by approximately
$41.5 million in the 53 week as net receipts of Fall season merchandise exceeded sales consistent with our normal operating cycle. Based on
our current inventory position, we will continue to closely monitor and align our inventory levels and purchases with anticipated customer
demand.
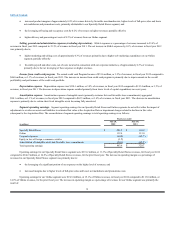
· Selling, general and administrative expenses (excluding depreciation) (SG&A) - SG&A represented 22.8% of revenues in fiscal year
2013, a decrease of 0.6% of revenues compared to fiscal year 2012. The lower level of SG&A expenses, as a percentage of revenues, primarily
reflects 1) lower current and long-term incentive compensation costs and 2) the leveraging of payroll and other costs on higher revenues, partially
offset by 3) higher planned selling and online marketing costs incurred in connection with the continuing expansion of our e-commerce and
omni-channel capabilities.
· Operating earnings - Total operating earnings in fiscal year 2013 were $446.4 million, or 9.6% of revenues, compared to $403.6 million, or
9.3% of revenues, in fiscal year 2012. Our operating earnings margin increased by 0.3% of revenues in fiscal year 2013 primarily due to:
25
rd
rd
rd
rd