Neiman Marcus 2012 Annual Report Download - page 132
Download and view the complete annual report
Please find page 132 of the 2012 Neiman Marcus annual report below. You can navigate through the pages in the report by either clicking on the pages listed below, or by using the keyword search tool below to find specific information within the annual report.-
 1
1 -
2
-
3
-
4
-
5
-
6
-
7
-
8
-
9
-
10
-
11
-
12
-
13
-
14
-
15
-
16
-
17
-
18
-
19
-
20
-
21
-
22
-
23
-
24
-
25
-
26
-
27
-
28
-
29
-
30
-
31
-
32
-
33
-
34
-
35
-
36
-
37
-
38
-
39
-
40
-
41
-
42
-
43
-
44
-
45
-
46
-
47
-
48
-
49
-
50
-
51
-
52
-
53
-
54
-
55
-
56
-
57
-
58
-
59
-
60
-
61
-
62
-
63
-
64
-
65
-
66
-
67
-
68
-
69
-
70
-
71
-
72
-
73
-
74
-
75
-
76
-
77
-
78
-
79
-
80
-
81
-
82
-
83
-
84
-
85
-
86
-
87
-
88
-
89
-
90
-
91
-
92
-
93
-
94
-
95
-
96
-
97
-
98
-
99
-
100
-
101
-
102
-
103
-
104
-
105
-
106
-
107
-
108
-
109
-
110
-
111
-
112
-
113
-
114
-
115
-
116
-
117
-
118
-
119
-
120
-
121
-
 122
122 -
 123
123 -
 124
124 -
 125
125 -
 126
126 -
 127
127 -
 128
128 -
 129
129 -
 130
130 -
 131
131 -
 132
132 -
 133
133 -
 134
134 -
 135
135 -
 136
136 -
 137
137 -
 138
138 -
 139
139 -
 140
140 -
 141
141 -
 142
142 -
143
-
144
-
145
-
146
-
147
-
148
-
149
-
150
-
151
-
152
-
153
-
154
-
155
-
156
-
157
-
158
-
159
-
160
-
161
-
162
-
163
-
164
-
165
-
166
-
167
-
168
-
169
-
170
-
171
-
172
-
173
-
174
-
175
-
176
-
177
 |
 |

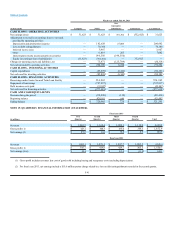
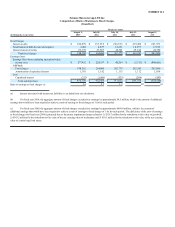
Table of Contents
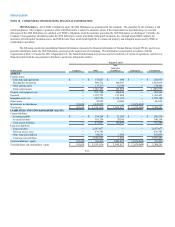
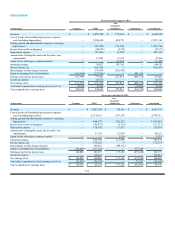
Fiscal year ended August 3, 2013
(in thousands) Company NMG
Non-
Guarantor
Subsidiaries Eliminations Consolidated
Revenues $ — $ 3,875,580 $772,669 $ — $ 4,648,249
Cost of goods sold including buying and occupancy
costs (excluding depreciation) — 2,500,640 494,723 —2,995,363
Selling, general and administrative expenses (excluding
depreciation) —921,850 135,946 —1,057,796
Income from credit card program — (48,635) (4,738) — (53,373)
Depreciation expense —127,606 13,909 —141,515
Amortization of intangible assets and favorable lease
commitments —35,092 12,344 —47,436
Equity in loss of foreign e-commerce retailer — — 13,125 —13,125
Operating earnings —339,027 107,360 —446,387
Interest expense, net —168,952 3—168,955
Intercompany royalty charges (income) — 130,459 (130,459) — —
Equity in (earnings) loss of subsidiaries (163,699) (237,816) — 401,515 —
Earnings (loss) before income taxes 163,699 277,432 237,816 (401,515) 277,432
Income tax expense —113,733 — — 113,733
Net earnings (loss) $163,699 $163,699 $237,816 $ (401,515) $ 163,699
Total other comprehensive earnings (loss), net of tax 41,263 41,263 — (41,263) 41,263
Total comprehensive earnings (loss) $204,962 $204,962 $237,816 $(442,778)$204,962
Fiscal year ended July 28, 2012
(in thousands) Company NMG
Non-
Guarantor
Subsidiaries Eliminations Consolidated
Revenues $ — $ 3,607,190 $738,184 $ — $ 4,345,374
Cost of goods sold including buying and occupancy
costs (excluding depreciation) —2,319,516 475,197 —2,794,713
Selling, general and administrative expenses (excluding
depreciation) —890,677 126,225 —1,016,902
Income from credit card program —(46,957)(4,614) — (51,571)
Depreciation expense —116,142 13,977 —130,119
Amortization of intangible assets and favorable lease
commitments —37,224 12,899 — 50,123
Equity in loss of foreign e-commerce retailer — — 1,514 —1,514
Operating earnings —290,588 112,986 —403,574
Interest expense, net —175,232 5 — 175,237
Intercompany royalty charges (income) —204,181 (204,181) — —
Equity in (earnings) loss of subsidiaries (140,086) (317,162) — 457,248 —
Earnings (loss) before income taxes 140,086 228,337 317,162 (457,248)228,337
Income tax expense —88,251 — — 88,251
Net earnings (loss) $140,086 $140,086 $317,162 $(457,248) $ 140,086
Total other comprehensive (loss) earnings, net of tax (75,747) (75,747) — 75,747 (75,747)
Total comprehensive earnings (loss) $ 64,339 $ 64,339 $ 317,162 $(381,501)$ 64,339
F-38