Neiman Marcus 2012 Annual Report Download - page 136
Download and view the complete annual report
Please find page 136 of the 2012 Neiman Marcus annual report below. You can navigate through the pages in the report by either clicking on the pages listed below, or by using the keyword search tool below to find specific information within the annual report.-
 1
1 -
2
-
3
-
4
-
5
-
6
-
7
-
8
-
9
-
10
-
11
-
12
-
13
-
14
-
15
-
16
-
17
-
18
-
19
-
20
-
21
-
22
-
23
-
24
-
25
-
26
-
27
-
28
-
29
-
30
-
31
-
32
-
33
-
34
-
35
-
36
-
37
-
38
-
39
-
40
-
41
-
42
-
43
-
44
-
45
-
46
-
47
-
48
-
49
-
50
-
51
-
52
-
53
-
54
-
55
-
56
-
57
-
58
-
59
-
60
-
61
-
62
-
63
-
64
-
65
-
66
-
67
-
68
-
69
-
70
-
71
-
72
-
73
-
74
-
75
-
76
-
77
-
78
-
79
-
80
-
81
-
82
-
83
-
84
-
85
-
86
-
87
-
88
-
89
-
90
-
91
-
92
-
93
-
94
-
95
-
96
-
97
-
98
-
99
-
100
-
101
-
102
-
103
-
104
-
105
-
106
-
107
-
108
-
109
-
110
-
111
-
112
-
113
-
114
-
115
-
116
-
117
-
118
-
119
-
120
-
121
-
122
-
123
-
124
-
125
-
 126
126 -
 127
127 -
 128
128 -
 129
129 -
 130
130 -
 131
131 -
 132
132 -
 133
133 -
 134
134 -
 135
135 -
 136
136 -
 137
137 -
 138
138 -
 139
139 -
 140
140 -
 141
141 -
 142
142 -
 143
143 -
 144
144 -
 145
145 -
 146
146 -
147
-
148
-
149
-
150
-
151
-
152
-
153
-
154
-
155
-
156
-
157
-
158
-
159
-
160
-
161
-
162
-
163
-
164
-
165
-
166
-
167
-
168
-
169
-
170
-
171
-
172
-
173
-
174
-
175
-
176
-
177
 |
 |

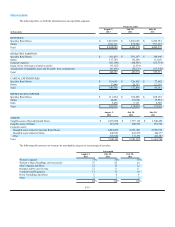
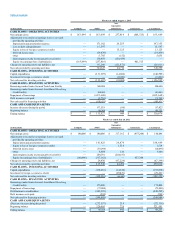
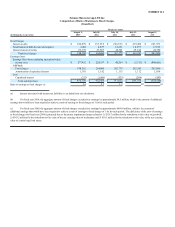
Table of Contents
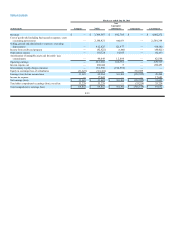
Fiscal year ended July 30, 2011
(in thousands) Company NMG
Non-
Guarantor
Subsidiaries Eliminations Consolidated
CASH FLOWS - OPERATING ACTIVITIES
Net earnings (loss) $ 31,623 $ 31,623 $ 301,302 $ (332,925) $ 31,623
Adjustments to reconcile net earnings (loss) to net cash
provided by operating activities:
Depreciation and amortization expense —182,638 27,004 —209,642
Loss on debt extinguishment —70,388 — — 70,388
Deferred income taxes —3,967 — — 3,967
Other —6,819 263 — 7,082
Intercompany royalty income payable (receivable) —194,556 (194,556) — —
Equity in (earnings) loss of subsidiaries (31,623)(301,302) — 332,925 —
Changes in operating assets and liabilities, net —75,471 (125,789) — (50,318)
Net cash provided by operating activities —264,160 8,224 — 272,384
CASH FLOWS - INVESTING ACTIVITIES
Capital expenditures —(85,839)(8,342) — (94,181)
Net cash used for investing activities —(85,839)(8,342) — (94,181)
CASH FLOWS - FINANCING ACTIVITIES
Borrowings under Senior Secured Term Loan Facility —554,265 — — 554,265
Repayment of borrowings —(797,937) — — (797,937)
Debt issuance costs paid —(33,947) — — (33,947)
Net cash used for financing activities —(277,619) — — (277,619)
CASH AND CASH EQUIVALENTS
Decrease during the period —(99,298)(118) — (99,416)
Beginning balance —420,163 844 —421,007
Ending balance $ — $ 320,865 $726 $ — $ 321,591
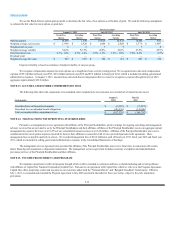
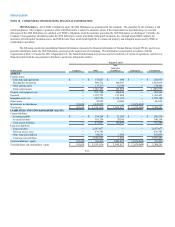
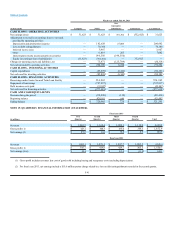
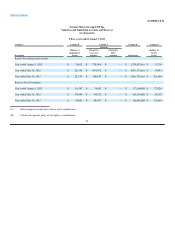
NOTE 19. QUARTERLY FINANCIAL INFORMATION (UNAUDITED)
Fiscal year 2013
(in millions)
First
Quarter
Second
Quarter
Third
Quarter
Fourth
Quarter Total
Revenues $1,068.5 $ 1,362.4 $ 1,098.3 $ 1,119.0 $ 4,648.2
Gross profit (1) $423.1 $440.7 $435.0 $354.1 $1,652.9
Net earnings (2) $49.6 $40.4 $70.8 $2.9 $ 163.7
Fiscal year 2012
Revenues $1,003.1 $1,279.1 $1,057.7 $1,005.5 $4,345.4
Gross profit (1) $395.7 $ 419.8 $ 429.7 $ 305.5 $ 1,550.7
Net earnings (loss) $48.4 $40.1 $62.6 $(11.0)$140.1
(1) Gross profit includes revenues less cost of goods sold including buying and occupancy costs (excluding depreciation).
(2) For fiscal year 2013, net earnings include a $15.6 million pretax charge related to a loss on debt extinguishment recorded in the second quarter.
F-41