Neiman Marcus 2012 Annual Report Download - page 129
Download and view the complete annual report
Please find page 129 of the 2012 Neiman Marcus annual report below. You can navigate through the pages in the report by either clicking on the pages listed below, or by using the keyword search tool below to find specific information within the annual report.-
 1
1 -
2
-
3
-
4
-
5
-
6
-
7
-
8
-
9
-
10
-
11
-
12
-
13
-
14
-
15
-
16
-
17
-
18
-
19
-
20
-
21
-
22
-
23
-
24
-
25
-
26
-
27
-
28
-
29
-
30
-
31
-
32
-
33
-
34
-
35
-
36
-
37
-
38
-
39
-
40
-
41
-
42
-
43
-
44
-
45
-
46
-
47
-
48
-
49
-
50
-
51
-
52
-
53
-
54
-
55
-
56
-
57
-
58
-
59
-
60
-
61
-
62
-
63
-
64
-
65
-
66
-
67
-
68
-
69
-
70
-
71
-
72
-
73
-
74
-
75
-
76
-
77
-
78
-
79
-
80
-
81
-
82
-
83
-
84
-
85
-
86
-
87
-
88
-
89
-
90
-
91
-
92
-
93
-
94
-
95
-
96
-
97
-
98
-
99
-
100
-
101
-
102
-
103
-
104
-
105
-
106
-
107
-
108
-
109
-
110
-
111
-
112
-
113
-
114
-
115
-
116
-
117
-
118
-
 119
119 -
 120
120 -
 121
121 -
 122
122 -
 123
123 -
 124
124 -
 125
125 -
 126
126 -
 127
127 -
 128
128 -
 129
129 -
 130
130 -
 131
131 -
 132
132 -
 133
133 -
 134
134 -
 135
135 -
 136
136 -
 137
137 -
 138
138 -
 139
139 -
140
-
141
-
142
-
143
-
144
-
145
-
146
-
147
-
148
-
149
-
150
-
151
-
152
-
153
-
154
-
155
-
156
-
157
-
158
-
159
-
160
-
161
-
162
-
163
-
164
-
165
-
166
-
167
-
168
-
169
-
170
-
171
-
172
-
173
-
174
-
175
-
176
-
177
 |
 |

Table of Contents
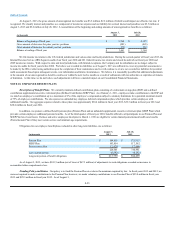
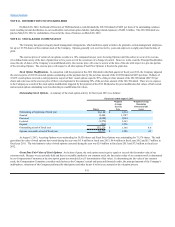
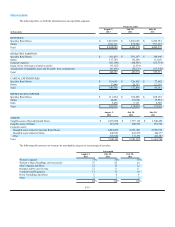
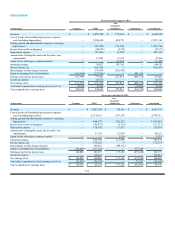
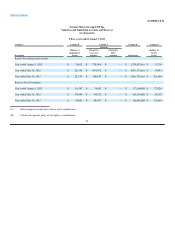
The following tables set forth the information for our reportable segments:
Fiscal year ended
August 3, July 28, July 30,
(in thousands) 2013 2012 2011
REVENUES
Specialty Retail Stores $3,616,938 $3,466,628 $3,245,153
Online 1,031,311 878,746 757,119
Total $4,648,249 $4,345,374 $4,002,272
OPERATING EARNINGS
Specialty Retail Stores $411,435 $391,197 $344,946
Online 157,703 132,360 113,033
Corporate expenses (62,190) (68,346) (65,714)
Equity in loss of foreign e-commerce retailer (13,125) (1,514) —
Amortization of intangible assets and favorable lease commitments (47,436)(50,123)(62,548)
Total $446,387 $403,574 $329,717
CAPITAL EXPENDITURES
Specialty Retail Stores $119,065 $126,485 $ 73,062
Online 27,440 26,353 21,119
Total $146,505 $152,838 $94,181
DEPRECIATION EXPENSE
Specialty Retail Stores $111,964 $106,288 $108,192
Online 24,081 18,660 17,932
Other 5,470 5,171 6,309
Total $141,515 $130,119 $132,433
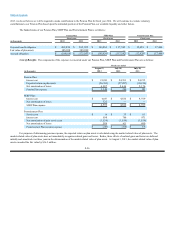
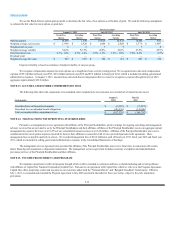
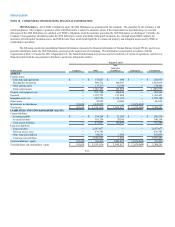
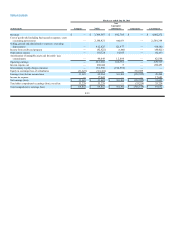
August 3, July 28, July 30,
2013 2012 2011
ASSETS
Tangible assets of Specialty Retail Stores $1,818,888 $1,777,112 $ 1,640,450
Tangible assets of Online 219,230 200,553 179,792
Corporate assets:
Intangible assets related to Specialty Retail Stores 2,604,600 2,651,481 2,698,363
Intangible assets related to Online 440,981 441,536 444,777
Other 216,542 131,173 401,387
Total $5,300,241 $5,201,855 $5,364,769
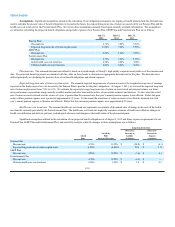
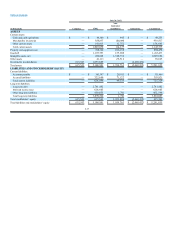
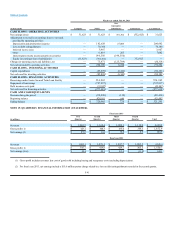
The following table presents our revenues by merchandise category as a percentage of net sales:
Years ended
August 3,
2013
July 28,
2012
July 30,
2011
Women’s Apparel 31%34%35%
Women’s Shoes, Handbags and Accessories 27 25 24
Men’s Apparel and Shoes 12 12 12
Designer and Precious Jewelry 12 11 11
Cosmetics and Fragrances 11 11 10
Home Furnishings and Décor 566
Other 212
100%100%100%
F-35