Neiman Marcus 2012 Annual Report Download - page 122
Download and view the complete annual report
Please find page 122 of the 2012 Neiman Marcus annual report below. You can navigate through the pages in the report by either clicking on the pages listed below, or by using the keyword search tool below to find specific information within the annual report.-
 1
1 -
2
-
3
-
4
-
5
-
6
-
7
-
8
-
9
-
10
-
11
-
12
-
13
-
14
-
15
-
16
-
17
-
18
-
19
-
20
-
21
-
22
-
23
-
24
-
25
-
26
-
27
-
28
-
29
-
30
-
31
-
32
-
33
-
34
-
35
-
36
-
37
-
38
-
39
-
40
-
41
-
42
-
43
-
44
-
45
-
46
-
47
-
48
-
49
-
50
-
51
-
52
-
53
-
54
-
55
-
56
-
57
-
58
-
59
-
60
-
61
-
62
-
63
-
64
-
65
-
66
-
67
-
68
-
69
-
70
-
71
-
72
-
73
-
74
-
75
-
76
-
77
-
78
-
79
-
80
-
81
-
82
-
83
-
84
-
85
-
86
-
87
-
88
-
89
-
90
-
91
-
92
-
93
-
94
-
95
-
96
-
97
-
98
-
99
-
100
-
101
-
102
-
103
-
104
-
105
-
106
-
107
-
108
-
109
-
110
-
111
-
 112
112 -
 113
113 -
 114
114 -
 115
115 -
 116
116 -
 117
117 -
 118
118 -
 119
119 -
 120
120 -
 121
121 -
 122
122 -
 123
123 -
 124
124 -
 125
125 -
 126
126 -
 127
127 -
 128
128 -
 129
129 -
 130
130 -
 131
131 -
 132
132 -
133
-
134
-
135
-
136
-
137
-
138
-
139
-
140
-
141
-
142
-
143
-
144
-
145
-
146
-
147
-
148
-
149
-
150
-
151
-
152
-
153
-
154
-
155
-
156
-
157
-
158
-
159
-
160
-
161
-
162
-
163
-
164
-
165
-
166
-
167
-
168
-
169
-
170
-
171
-
172
-
173
-
174
-
175
-
176
-
177
 |
 |

Table of Contents
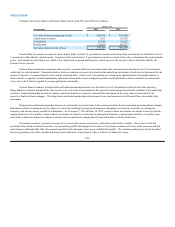
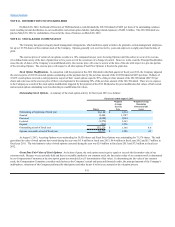
Changes in the assets held by our Pension Plan in fiscal years 2013 and 2012 are as follows:
Fiscal years
(in thousands) 2013 2012
Fair value of assets at beginning of year $389,899 $376,369
Actual return on assets 3,513 26,520
Contribution 25,049 29,282
Benefits paid (32,623)(42,272)
Fair value of assets at end of year $ 385,838 $ 389,899
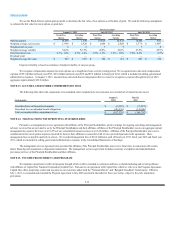
Pension Plan investments in corporate stock, mutual funds, certain U.S. government securities and certain other investments are classified as Level
1 investments within the fair value hierarchy. Corporate stocks and certain U.S. government securities are stated at fair value as determined by quoted market
prices. Investments in mutual funds are valued at fair value based on quoted market prices, which represent the net asset value of the shares held by the
Pension Plan at year-end.
Pension Plan investments in corporate debt securities, common/collective trusts and certain other investments are classified as Level 2 investments
within the fair value hierarchy. Common/collective trusts are valued at net asset value based on the underlying investments of such trust as determined by the
sponsor of the trust. Common/collective trusts can be redeemed daily. Other Level 2 investments are valued using updated quotes from market makers or
broker-dealers recognized as market participants, information from market sources integrating relative credit information, observed market movements and
sector news, all of which is applied to pricing applications and models.
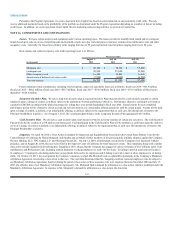
Pension Plan investments in hedge funds and limited partnership interests are classified as Level 3 investments within the fair value hierarchy.
Hedge funds are valued at estimated fair value based on net asset value as determined by the respective fund manager based on the valuation of the underlying
securities. Limited partnership interests in venture capital investments are valued at estimated fair value based on net asset value as determined by the
respective fund investment manager. The hedge funds and limited partnerships allocate gains, losses and expenses to the Pension Plan as described in the
agreements.
Hedge funds and limited partnership interests are redeemable at net asset value to the extent provided in the documentation governing the investments.
Redemption of these investments may be subject to restrictions including lock-up periods where no redemptions are allowed, restrictions on redemption
frequency and advance notice periods for redemptions. As of August 3, 2013 and July 28, 2012, certain of these investments are subject to lock-up periods,
ranging from two to five months, certain of these investments are subject to restrictions on redemption frequency, ranging from monthly to every three years
and certain of these investments are subject to advance notice requirements, ranging from 30-day notification to 90-day notification.
Investment securities, in general, are exposed to various risks such as interest rate, credit and overall market volatility. Due to the level of risk
associated with certain investment securities, it is reasonably possible that changes in the values of investment securities will occur in the near term and that
such changes could materially affect the amounts reported in the statements of net assets available for benefits. The valuation methods previously described
above may produce a fair value calculation that may not be indicative of net realized value or reflective of future fair values.
F-28