Neiman Marcus 2012 Annual Report Download - page 26
Download and view the complete annual report
Please find page 26 of the 2012 Neiman Marcus annual report below. You can navigate through the pages in the report by either clicking on the pages listed below, or by using the keyword search tool below to find specific information within the annual report.-
 1
1 -
2
-
3
-
4
-
5
-
6
-
7
-
8
-
9
-
10
-
11
-
12
-
13
-
14
-
15
-
 16
16 -
 17
17 -
 18
18 -
 19
19 -
 20
20 -
 21
21 -
 22
22 -
 23
23 -
 24
24 -
 25
25 -
 26
26 -
 27
27 -
 28
28 -
 29
29 -
 30
30 -
 31
31 -
 32
32 -
 33
33 -
 34
34 -
 35
35 -
 36
36 -
37
-
38
-
39
-
40
-
41
-
42
-
43
-
44
-
45
-
46
-
47
-
48
-
49
-
50
-
51
-
52
-
53
-
54
-
55
-
56
-
57
-
58
-
59
-
60
-
61
-
62
-
63
-
64
-
65
-
66
-
67
-
68
-
69
-
70
-
71
-
72
-
73
-
74
-
75
-
76
-
77
-
78
-
79
-
80
-
81
-
82
-
83
-
84
-
85
-
86
-
87
-
88
-
89
-
90
-
91
-
92
-
93
-
94
-
95
-
96
-
97
-
98
-
99
-
100
-
101
-
102
-
103
-
104
-
105
-
106
-
107
-
108
-
109
-
110
-
111
-
112
-
113
-
114
-
115
-
116
-
117
-
118
-
119
-
120
-
121
-
122
-
123
-
124
-
125
-
126
-
127
-
128
-
129
-
130
-
131
-
132
-
133
-
134
-
135
-
136
-
137
-
138
-
139
-
140
-
141
-
142
-
143
-
144
-
145
-
146
-
147
-
148
-
149
-
150
-
151
-
152
-
153
-
154
-
155
-
156
-
157
-
158
-
159
-
160
-
161
-
162
-
163
-
164
-
165
-
166
-
167
-
168
-
169
-
170
-
171
-
172
-
173
-
174
-
175
-
176
-
177
 |
 |

Table of Contents
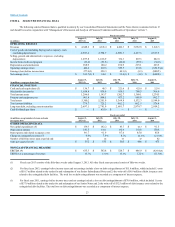
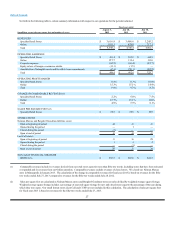
(4) For fiscal year 2009, operating loss and EBITDA include pretax impairment charges related to 1) $329.7 million for the writedown to fair value of
goodwill, 2) $343.2 million for the writedown to fair value of the net carrying value of tradenames and 3) $30.3 million for the writedown to fair
value of the net carrying value of certain long-lived assets. Excluding pretax impairment charges of $703.2 million, fiscal year 2009 Adjusted
EBITDA was $273.8 million, or 7.5% of revenues.
(5) On August 29, 2013, we made a voluntary prepayment of $126.9 million on our Senior Secured Term Loan Facility, which was funded by cash
on hand and borrowings of $100.0 million under our Senior Secured Asset-Based Revolving Credit Facility.
(6) Amounts are net of developer contributions of $7.2 million, $10.6 million, $10.5 million, $14.4 million and $10.0 million, respectively, for the
periods presented.
(7) Comparable revenues include 1) revenues derived from our retail stores open for more than fifty-two weeks, including stores that have been relocated
or expanded and 2) revenues from our Online operation. Comparable revenues exclude revenues of closed stores. We closed our Neiman Marcus
store in Minneapolis in January 2013. The calculation of the change in comparable revenues for fiscal year 2013 is based on revenues for the fifty-
two weeks ended July 27, 2013 compared to revenues for the fifty-two weeks ended July 28, 2012.
(8) Sales per square foot are calculated as Neiman Marcus stores and Bergdorf Goodman stores net sales divided by weighted average square footage.
Weighted average square footage includes a percentage of year-end square footage for new and closed stores equal to the percentage of the year during
which they were open. Our small format stores (Last Call and CUSP) are not included in this calculation. Sales per square foot for fiscal year 2013
are based on revenues for the fifty-two weeks ended July 27, 2013.
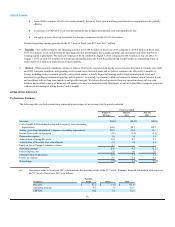
(9) For an explanation of EBITDA as a measure of our operating performance and a reconciliation to net earnings, see Item 7, “Management’s
Discussion and Analysis of Financial Condition and Results of Operations — Non-GAAP Financial Measure-EBITDA and Adjusted EBITDA.”
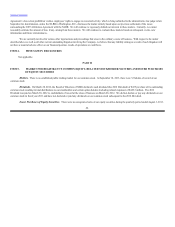
ITEM 7. MANAGEMENT’S DISCUSSION AND ANALYSIS OF FINANCIAL CONDITION AND RESULTS OF OPERATIONS
EXECUTIVE OVERVIEW
The following discussion and analysis of our financial condition and results of operations should be read in conjunction with our audited
Consolidated Financial Statements and related notes. Unless otherwise specified, the meanings of all defined terms in Management’s Discussion and Analysis
of Financial Condition and Results of Operations (MD&A) are consistent with the meanings of such terms as defined in the Notes to Consolidated Financial
Statements. This discussion contains forward-looking statements. Please see “—Other Matters—Factors That May Affect Future Results” for a discussion
of the risks, uncertainties and assumptions relating to these statements.
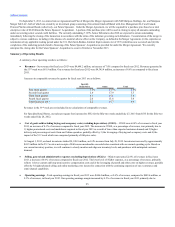
Business Overview
We are a luxury, multi-branded, omni-channel fashion retailer conducting integrated store and online operations principally under the Neiman
Marcus and Bergdorf Goodman brand names. We report our store operations as our Specialty Retail Stores segment and our direct-to-consumer operations as
our Online segment.
We are currently a subsidiary of Newton Holding, LLC (Holding), which is controlled by the Principal Stockholders. Our operations are conducted
through our wholly-owned subsidiary, The Neiman Marcus Group, Inc. (NMG). The Principal Stockholders acquired us in a leveraged transaction in
October 2005 (the Acquisition).
Our fiscal year ends on the Saturday closest to July 31. Like many other retailers, we follow a 4-5-4 reporting calendar, which means that each fiscal
quarter consists of thirteen weeks divided into periods of four weeks, five weeks and four weeks. This resulted in an extra week in fiscal year 2013 (the
53 week). All references to fiscal year 2013 relate to the fifty-three weeks ended August 3, 2013, all references to fiscal year 2012 relate to the fifty-two weeks
ended July 28, 2012 and all references to fiscal year 2011 relate to the fifty-two weeks ended July 30, 2011.
24
rd