Neiman Marcus 2012 Annual Report Download - page 100
Download and view the complete annual report
Please find page 100 of the 2012 Neiman Marcus annual report below. You can navigate through the pages in the report by either clicking on the pages listed below, or by using the keyword search tool below to find specific information within the annual report.-
 1
1 -
2
-
3
-
4
-
5
-
6
-
7
-
8
-
9
-
10
-
11
-
12
-
13
-
14
-
15
-
16
-
17
-
18
-
19
-
20
-
21
-
22
-
23
-
24
-
25
-
26
-
27
-
28
-
29
-
30
-
31
-
32
-
33
-
34
-
35
-
36
-
37
-
38
-
39
-
40
-
41
-
42
-
43
-
44
-
45
-
46
-
47
-
48
-
49
-
50
-
51
-
52
-
53
-
54
-
55
-
56
-
57
-
58
-
59
-
60
-
61
-
62
-
63
-
64
-
65
-
66
-
67
-
68
-
69
-
70
-
71
-
72
-
73
-
74
-
75
-
76
-
77
-
78
-
79
-
80
-
81
-
82
-
83
-
84
-
85
-
86
-
87
-
88
-
89
-
 90
90 -
 91
91 -
 92
92 -
 93
93 -
 94
94 -
 95
95 -
 96
96 -
 97
97 -
 98
98 -
 99
99 -
 100
100 -
 101
101 -
 102
102 -
 103
103 -
 104
104 -
 105
105 -
 106
106 -
 107
107 -
 108
108 -
 109
109 -
 110
110 -
111
-
112
-
113
-
114
-
115
-
116
-
117
-
118
-
119
-
120
-
121
-
122
-
123
-
124
-
125
-
126
-
127
-
128
-
129
-
130
-
131
-
132
-
133
-
134
-
135
-
136
-
137
-
138
-
139
-
140
-
141
-
142
-
143
-
144
-
145
-
146
-
147
-
148
-
149
-
150
-
151
-
152
-
153
-
154
-
155
-
156
-
157
-
158
-
159
-
160
-
161
-
162
-
163
-
164
-
165
-
166
-
167
-
168
-
169
-
170
-
171
-
172
-
173
-
174
-
175
-
176
-
177
 |
 |

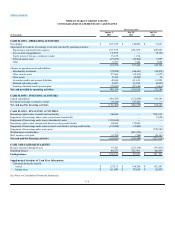
Table of Contents
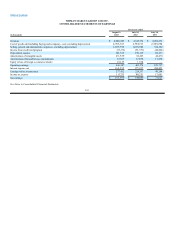
NEIMAN MARCUS GROUP LTD INC.
CONSOLIDATED STATEMENTS OF EARNINGS
Fiscal year ended
(in thousands)
August 3,
2013
July 28,
2012
July 30,
2011
Revenues $4,648,249 $4,345,374 $4,002,272
Cost of goods sold including buying and occupancy costs (excluding depreciation) 2,995,363 2,794,713 2,589,294
Selling, general and administrative expenses (excluding depreciation) 1,057,796 1,016,902 934,302
Income from credit card program (53,373)(51,571)(46,022)
Depreciation expense 141,515 130,119 132,433
Amortization of intangible assets 29,559 32,245 44,670
Amortization of favorable lease commitments 17,877 17,878 17,878
Equity in loss of foreign e-commerce retailer 13,125 1,514 —
Operating earnings 446,387 403,574 329,717
Interest expense, net 168,955 175,237 280,453
Earnings before income taxes 277,432 228,337 49,264
Income tax expense 113,733 88,251 17,641
Net earnings $163,699 $140,086 $ 31,623
See Notes to Consolidated Financial Statements.
F-6