Neiman Marcus 2012 Annual Report Download - page 37
Download and view the complete annual report
Please find page 37 of the 2012 Neiman Marcus annual report below. You can navigate through the pages in the report by either clicking on the pages listed below, or by using the keyword search tool below to find specific information within the annual report.-
 1
1 -
2
-
3
-
4
-
5
-
6
-
7
-
8
-
9
-
10
-
11
-
12
-
13
-
14
-
15
-
16
-
17
-
18
-
19
-
20
-
21
-
22
-
23
-
24
-
25
-
26
-
 27
27 -
 28
28 -
 29
29 -
 30
30 -
 31
31 -
 32
32 -
 33
33 -
 34
34 -
 35
35 -
 36
36 -
 37
37 -
 38
38 -
 39
39 -
 40
40 -
 41
41 -
 42
42 -
 43
43 -
 44
44 -
 45
45 -
 46
46 -
 47
47 -
48
-
49
-
50
-
51
-
52
-
53
-
54
-
55
-
56
-
57
-
58
-
59
-
60
-
61
-
62
-
63
-
64
-
65
-
66
-
67
-
68
-
69
-
70
-
71
-
72
-
73
-
74
-
75
-
76
-
77
-
78
-
79
-
80
-
81
-
82
-
83
-
84
-
85
-
86
-
87
-
88
-
89
-
90
-
91
-
92
-
93
-
94
-
95
-
96
-
97
-
98
-
99
-
100
-
101
-
102
-
103
-
104
-
105
-
106
-
107
-
108
-
109
-
110
-
111
-
112
-
113
-
114
-
115
-
116
-
117
-
118
-
119
-
120
-
121
-
122
-
123
-
124
-
125
-
126
-
127
-
128
-
129
-
130
-
131
-
132
-
133
-
134
-
135
-
136
-
137
-
138
-
139
-
140
-
141
-
142
-
143
-
144
-
145
-
146
-
147
-
148
-
149
-
150
-
151
-
152
-
153
-
154
-
155
-
156
-
157
-
158
-
159
-
160
-
161
-
162
-
163
-
164
-
165
-
166
-
167
-
168
-
169
-
170
-
171
-
172
-
173
-
174
-
175
-
176
-
177
 |
 |

Table of Contents
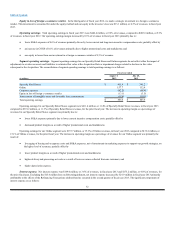
· the leveraging of a significant portion of our expenses on the higher level of revenues; partially offset by
· decreased margins primarily due to higher delivery and processing net costs, partially offset by favorable product margins; and
· higher marketing and selling costs.
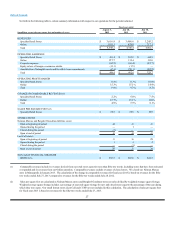
Interest expense, net. Net interest expense was $175.2 million, or 4.0% of revenues, in fiscal year 2012 and $280.5 million, or 7.0% of revenues,
for the prior fiscal year. The net decrease in interest expense is primarily due to 1) the repurchase and redemption of our 9.0%/9.75% Senior Notes due 2015
(the Senior Notes) in the fourth quarter of fiscal year 2011, partially offset by 2) higher interest expense incurred on the higher Senior Secured Term Loan
Facility borrowings. Additionally, we incurred a loss on debt extinguishment of $70.4 million in the fourth quarter of fiscal year 2011.
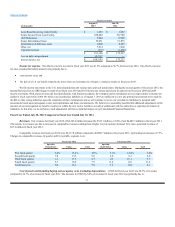
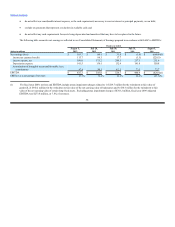
The significant components of interest expense are as follows:
Fiscal year ended
July 28, July 30,
(in thousands) 2012 2011
Asset-Based Revolving Credit Facility $1,052 $ —
Senior Secured Term Loan Facility 98,989 75,233
2028 Debentures 8,906 8,881
Senior Notes —53,916
Senior Subordinated Notes 51,873 51,732
Amortization of debt issue costs 8,457 14,661
Other, net 7,040 6,177
Capitalized interest (1,080) (535)
$175,237 $210,065
Loss on debt extinguishment —70,388
Interest expense, net $175,237 $280,453
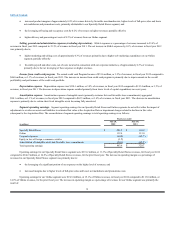
Income tax expense (benefit). Our effective income tax rate for fiscal year 2012 was 38.7% compared to 35.8% for fiscal year 2011. Our effective
income tax rate for fiscal year 2012 and fiscal year 2011 exceeded the statutory rate primarily due to state income taxes and settlements with taxing authorities.
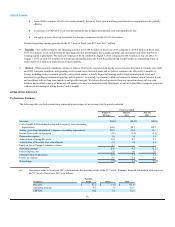
Non-GAAP Financial Measure — EBITDA and Adjusted EBITDA
We present the financial performance measures of earnings before interest, taxes, depreciation and amortization (EBITDA) and Adjusted EBITDA
with respect to fiscal year 2009 because we use these measures to monitor and evaluate the performance of our business and believe the presentation of these
measures will enhance investors’ ability to analyze trends in our business, evaluate our performance relative to other companies in our industry and evaluate
our ability to service our debt. EBITDA and Adjusted EBITDA are not prepared in accordance with generally accepted accounting principles in the United
States (GAAP). Our computations of EBITDA and Adjusted EBITDA may vary from others in our industry. In addition, we use performance targets based
on EBITDA as a component of the measurement of incentive compensation as described under “Executive Compensation — Compensation Discussion and
Analysis — 2013 Executive Officer Compensation.”
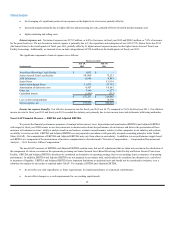
The non-GAAP measures of EBITDA and Adjusted EBITDA contain some, but not all, adjustments that are taken into account in the calculation of
the components of various covenants in the agreements governing our Senior Secured Asset-Based Revolving Credit Facility and Senior Secured Term Loan
Facility. EBITDA and Adjusted EBITDA should not be considered as alternatives to operating earnings (loss) or net earnings (loss) as measures of operating
performance. In addition, EBITDA and Adjusted EBITDA are not prepared in accordance with, and should not be considered as alternatives to, cash flows
as measures of liquidity. EBITDA and Adjusted EBITDA have important limitations as analytical tools and should not be considered in isolation, or as a
substitute for analysis of our results as reported under GAAP. For example, EBITDA and Adjusted EBITDA:
· do not reflect our cash expenditures, or future requirements, for capital expenditures or contractual commitments;
· do not reflect changes in, or cash requirements for, our working capital needs;
35