Neiman Marcus 2012 Annual Report Download - page 126
Download and view the complete annual report
Please find page 126 of the 2012 Neiman Marcus annual report below. You can navigate through the pages in the report by either clicking on the pages listed below, or by using the keyword search tool below to find specific information within the annual report.-
 1
1 -
2
-
3
-
4
-
5
-
6
-
7
-
8
-
9
-
10
-
11
-
12
-
13
-
14
-
15
-
16
-
17
-
18
-
19
-
20
-
21
-
22
-
23
-
24
-
25
-
26
-
27
-
28
-
29
-
30
-
31
-
32
-
33
-
34
-
35
-
36
-
37
-
38
-
39
-
40
-
41
-
42
-
43
-
44
-
45
-
46
-
47
-
48
-
49
-
50
-
51
-
52
-
53
-
54
-
55
-
56
-
57
-
58
-
59
-
60
-
61
-
62
-
63
-
64
-
65
-
66
-
67
-
68
-
69
-
70
-
71
-
72
-
73
-
74
-
75
-
76
-
77
-
78
-
79
-
80
-
81
-
82
-
83
-
84
-
85
-
86
-
87
-
88
-
89
-
90
-
91
-
92
-
93
-
94
-
95
-
96
-
97
-
98
-
99
-
100
-
101
-
102
-
103
-
104
-
105
-
106
-
107
-
108
-
109
-
110
-
111
-
112
-
113
-
114
-
115
-
 116
116 -
 117
117 -
 118
118 -
 119
119 -
 120
120 -
 121
121 -
 122
122 -
 123
123 -
 124
124 -
 125
125 -
 126
126 -
 127
127 -
 128
128 -
 129
129 -
 130
130 -
 131
131 -
 132
132 -
 133
133 -
 134
134 -
 135
135 -
 136
136 -
137
-
138
-
139
-
140
-
141
-
142
-
143
-
144
-
145
-
146
-
147
-
148
-
149
-
150
-
151
-
152
-
153
-
154
-
155
-
156
-
157
-
158
-
159
-
160
-
161
-
162
-
163
-
164
-
165
-
166
-
167
-
168
-
169
-
170
-
171
-
172
-
173
-
174
-
175
-
176
-
177
 |
 |

Table of Contents
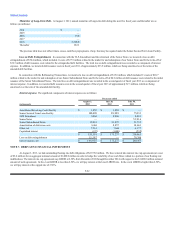
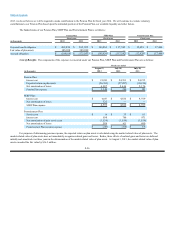
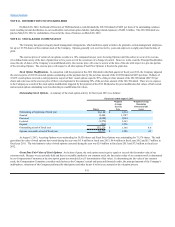
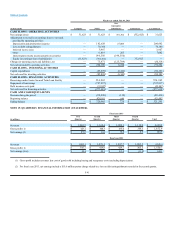
We use the Black-Scholes option-pricing model to determine the fair value of our options as of the date of grant. We used the following assumptions
to estimate the fair value for stock options at grant date:
Fiscal year ended
August 3, 2013 July 28, 2012 July 30, 2011
Fixed Price Accreting Fixed Price Accreting Fixed Price Accreting
Options Options Options Options Options Options
Options granted 10,860 1,540 19,828 10,678 10,000 650
Weighted average exercise price $1,996 $1,928 $1,844 $ 2,028 $ 1,576 $1,907
Weighted term in years 5 6 7 7 7 8
Weighted average volatility 54.2% 52.5% 49.0% 49.0% 47.6% 47.9%
Risk-free interest rate 0.7% - 1.0% 0.7% - 1.0% 1.5% - 1.6% 1.5% - 1.6% 1.9% - 2.5% 2.5%
Dividend yield — — — — — —
Weighted average fair value $ 947 $ 696 $940 $714 $807 $720
Expected volatility is based on estimates of implied volatility of our peer group.
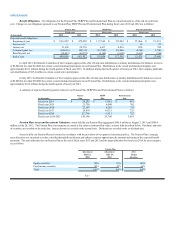
We recognize compensation expense for stock options on a straight-line basis over the vesting period. We recognized non-cash stock compensation
expense of $9.7 million in fiscal year 2013, $6.9 million in fiscal year 2012 and $3.9 million in fiscal year 2011, which is included in selling, general and
administrative expenses. At August 3, 2013, unearned non-cash stock-based compensation that we expect to recognize as expense through fiscal year 2018
aggregates approximately $29.2 million.
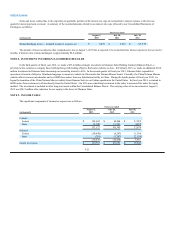
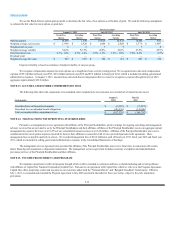
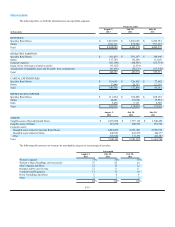
NOTE 13. ACCUMULATED OTHER COMPREHENSIVE LOSS
The following table shows the components of accumulated other comprehensive loss (amounts are recorded net of related income taxes):
August 3, July 28,
(in thousands) 2013 2012
Unrealized loss on financial instruments $(3,999) $ (5,592)
Unrealized loss on unfunded benefit obligations (103,530)(143,200)
Total accumulated other comprehensive loss $(107,529)$ (148,792)
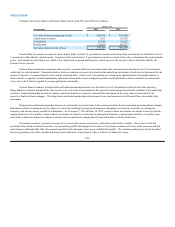
NOTE 14. TRANSACTIONS WITH PRINCIPAL STOCKHOLDERS
Pursuant to a management services agreement with affiliates of the Principal Stockholders, and in exchange for ongoing consulting and management
advisory services that are provided to us by the Principal Stockholders and their affiliates, affiliates of the Principal Stockholders receive an aggregate annual
management fee equal to the lesser of (i) 0.25% of our consolidated annual revenues or (ii) $10 million. Affiliates of the Principal Stockholders also receive
reimbursement for out-of-pocket expenses incurred by them or their affiliates in connection with services provided pursuant to the agreement. These
management fees are payable quarterly in arrears. We recorded management fees of $10.0 million in each of fiscal year 2013, fiscal year 2012 and fiscal year
2011, which are included in selling, general and administrative expenses in the Consolidated Statements of Earnings.
The management services agreement also provides that affiliates of the Principal Stockholders may receive future fees in connection with certain
future financing and acquisition or disposition transactions. The management services agreement includes customary exculpation and indemnification
provisions in favor of the Principal Stockholders and their affiliates.
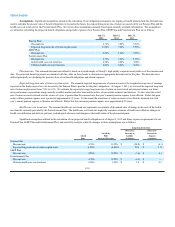
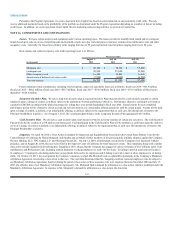
NOTE 15. INCOME FROM CREDIT CARD PROGRAM
We maintain a proprietary credit card program through which credit is extended to customers and have a related marketing and servicing alliance
with affiliates of Capital One Financial Corporation (Capital One). Pursuant to our agreement with Capital One, which we refer to as the Program Agreement,
Capital One offers proprietary credit card accounts to our customers under both the “Neiman Marcus” and “Bergdorf Goodman” brand names. Effective
July 1, 2013, we amended and extended the Program Agreement to July 2020 (renewable thereafter for three-year terms), subject to the early termination
provisions.
F-32