Neiman Marcus 2012 Annual Report Download - page 101
Download and view the complete annual report
Please find page 101 of the 2012 Neiman Marcus annual report below. You can navigate through the pages in the report by either clicking on the pages listed below, or by using the keyword search tool below to find specific information within the annual report.-
 1
1 -
2
-
3
-
4
-
5
-
6
-
7
-
8
-
9
-
10
-
11
-
12
-
13
-
14
-
15
-
16
-
17
-
18
-
19
-
20
-
21
-
22
-
23
-
24
-
25
-
26
-
27
-
28
-
29
-
30
-
31
-
32
-
33
-
34
-
35
-
36
-
37
-
38
-
39
-
40
-
41
-
42
-
43
-
44
-
45
-
46
-
47
-
48
-
49
-
50
-
51
-
52
-
53
-
54
-
55
-
56
-
57
-
58
-
59
-
60
-
61
-
62
-
63
-
64
-
65
-
66
-
67
-
68
-
69
-
70
-
71
-
72
-
73
-
74
-
75
-
76
-
77
-
78
-
79
-
80
-
81
-
82
-
83
-
84
-
85
-
86
-
87
-
88
-
89
-
90
-
 91
91 -
 92
92 -
 93
93 -
 94
94 -
 95
95 -
 96
96 -
 97
97 -
 98
98 -
 99
99 -
 100
100 -
 101
101 -
 102
102 -
 103
103 -
 104
104 -
 105
105 -
 106
106 -
 107
107 -
 108
108 -
 109
109 -
 110
110 -
 111
111 -
112
-
113
-
114
-
115
-
116
-
117
-
118
-
119
-
120
-
121
-
122
-
123
-
124
-
125
-
126
-
127
-
128
-
129
-
130
-
131
-
132
-
133
-
134
-
135
-
136
-
137
-
138
-
139
-
140
-
141
-
142
-
143
-
144
-
145
-
146
-
147
-
148
-
149
-
150
-
151
-
152
-
153
-
154
-
155
-
156
-
157
-
158
-
159
-
160
-
161
-
162
-
163
-
164
-
165
-
166
-
167
-
168
-
169
-
170
-
171
-
172
-
173
-
174
-
175
-
176
-
177
 |
 |

Table of Contents
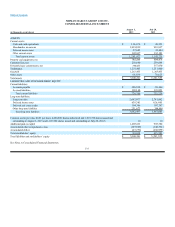
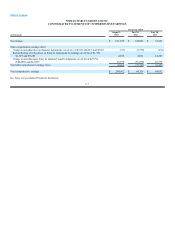
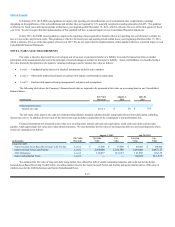
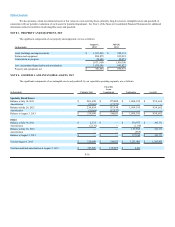
NEIMAN MARCUS GROUP LTD INC.
CONSOLIDATED STATEMENTS OF COMPREHENSIVE EARNINGS
Fiscal year ended
(in thousands)
August 3,
2013
July 28,
2012
July 30,
2011
Net earnings $163,699 $140,086 $ 31,623
Other comprehensive earnings (loss):
Change in unrealized loss on financial instruments, net of tax of ($333), ($2,457) and ($541) (513) (3,779) (830)
Reclassification of realized loss on financial instruments to earnings, net of tax of $1,369,
$1,307 and $9,289 2,106 2,011 14,287
Change in unrealized gain (loss) on unfunded benefit obligations, net of tax of $25,792,
($48,099) and $12,857 39,670 (73,979)19,772
Total other comprehensive earnings (loss) 41,263 (75,747) 33,229
Total comprehensive earnings $204,962 $ 64,339 $ 64,852
See Notes to Consolidated Financial Statements.
F-7