Neiman Marcus 2012 Annual Report Download - page 107
Download and view the complete annual report
Please find page 107 of the 2012 Neiman Marcus annual report below. You can navigate through the pages in the report by either clicking on the pages listed below, or by using the keyword search tool below to find specific information within the annual report.-
 1
1 -
2
-
3
-
4
-
5
-
6
-
7
-
8
-
9
-
10
-
11
-
12
-
13
-
14
-
15
-
16
-
17
-
18
-
19
-
20
-
21
-
22
-
23
-
24
-
25
-
26
-
27
-
28
-
29
-
30
-
31
-
32
-
33
-
34
-
35
-
36
-
37
-
38
-
39
-
40
-
41
-
42
-
43
-
44
-
45
-
46
-
47
-
48
-
49
-
50
-
51
-
52
-
53
-
54
-
55
-
56
-
57
-
58
-
59
-
60
-
61
-
62
-
63
-
64
-
65
-
66
-
67
-
68
-
69
-
70
-
71
-
72
-
73
-
74
-
75
-
76
-
77
-
78
-
79
-
80
-
81
-
82
-
83
-
84
-
85
-
86
-
87
-
88
-
89
-
90
-
91
-
92
-
93
-
94
-
95
-
96
-
 97
97 -
 98
98 -
 99
99 -
 100
100 -
 101
101 -
 102
102 -
 103
103 -
 104
104 -
 105
105 -
 106
106 -
 107
107 -
 108
108 -
 109
109 -
 110
110 -
 111
111 -
 112
112 -
 113
113 -
 114
114 -
 115
115 -
 116
116 -
 117
117 -
118
-
119
-
120
-
121
-
122
-
123
-
124
-
125
-
126
-
127
-
128
-
129
-
130
-
131
-
132
-
133
-
134
-
135
-
136
-
137
-
138
-
139
-
140
-
141
-
142
-
143
-
144
-
145
-
146
-
147
-
148
-
149
-
150
-
151
-
152
-
153
-
154
-
155
-
156
-
157
-
158
-
159
-
160
-
161
-
162
-
163
-
164
-
165
-
166
-
167
-
168
-
169
-
170
-
171
-
172
-
173
-
174
-
175
-
176
-
177
 |
 |

Table of Contents
Plan and the health care cost trend rate for the Postretirement Plan, as more fully described in Note 10 of the Notes to Consolidated Financial Statements. We
review these assumptions annually based upon currently available information, including information provided by our actuaries.
Our obligations related to our employee benefit plans are included in other long-term liabilities.
Self-insurance and Other Employee Benefit Reserves. We use estimates in the determination of the required accruals for general liability,
workers’ compensation and health insurance. We base these estimates upon an examination of historical trends, industry claims experience and independent
actuarial estimates. Although we do not expect that we will ultimately pay claims significantly different from our estimates, self-insurance reserves could be
affected if future claims experience differs significantly from our historical trends and assumptions.
Derivative Financial Instruments. We enter into derivative financial instruments, primarily interest rate cap agreements, to hedge the variability of
our cash flows related to a portion of our floating rate indebtedness. The derivative financial instruments are recorded at estimated fair value at each balance
sheet date and included in assets or liabilities in our Consolidated Balance Sheets.
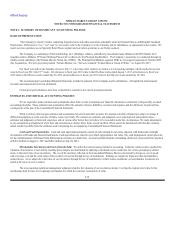
Revenues. Revenues include sales of merchandise and services and delivery and processing revenues related to merchandise sold. Revenues are
recognized at the later of the point of sale or the delivery of goods to the customer. Revenues associated with gift cards are recognized at the time of redemption
by the customer. Revenues exclude sales taxes collected from our customers.
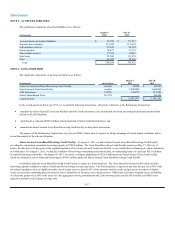
Revenues are reduced when customers return goods previously purchased. We maintain reserves for anticipated sales returns primarily based on our
historical trends related to returns by our customers. Our reserves for anticipated sales returns aggregated $37.4 million at August 3, 2013 and $34.0 million at
July 28, 2012.
Buying and Occupancy Costs. Our buying costs consist primarily of salaries and expenses incurred by our merchandising and buying
operations. Occupancy costs primarily include rent, property taxes and operating costs of our retail, distribution and support facilities and exclude
depreciation expense.
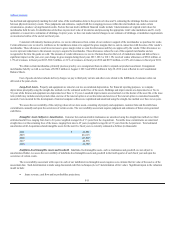
Selling, General and Administrative Expenses (excluding depreciation). Selling, general and administrative expenses are comprised
principally of the costs related to employee compensation and benefits in the selling and administrative support areas and advertising and marketing costs.
We receive allowances from certain merchandise vendors in conjunction with compensation programs for employees who sell the vendors’
merchandise. These allowances are netted against the related compensation expense that we incur. Amounts received from vendors related to compensation
programs were $72.2 million in fiscal year 2013, $65.1 million in fiscal year 2012 and $60.3 million in fiscal year 2011.
We incur costs to advertise and promote the merchandise assortment offered through our store and online operations. We expense advertising costs
for print media costs and promotional materials mailed to our customers at the time of mailing to the customer. We amortize the costs of print catalogs during
the periods we expect to generate revenues from such catalogs, generally three to six months. We expense the costs incurred to produce the photographic content
on our websites, as well as website design and web marketing costs, as incurred. Net marketing and advertising expenses were $126.9 million in fiscal year
2013, $106.5 million in fiscal year 2012 and $86.6 million in fiscal year 2011.
Consistent with industry practice, we receive advertising allowances from certain of our merchandise vendors. Substantially all the advertising
allowances we receive represent reimbursements of direct, specific and incremental costs that we incur to promote the vendor’s merchandise in connection with
our various advertising programs, primarily catalogs and other print media. Advertising allowances fluctuate based on the level of advertising expenses
incurred and are recorded as a reduction of our advertising costs when earned. Advertising allowances aggregated approximately $55.0 million in fiscal year
2013, $53.1 million in fiscal year 2012 and $49.3 million in fiscal year 2011.
Preopening expenses primarily consist of payroll and related media costs incurred in connection with store openings and major renovations and are
expensed when incurred. We incurred preopening expenses of $3.0 million in fiscal year 2013, $5.0 million in fiscal year 2012 and $0.8 million in fiscal year
2011.
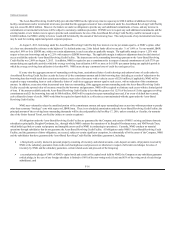
Income from Credit Card Program. We maintain a proprietary credit card program through which credit is extended to customers and have a
related marketing and servicing alliance with affiliates of Capital One Financial Corporation (Capital
F-13