Neiman Marcus 2012 Annual Report Download - page 25
Download and view the complete annual report
Please find page 25 of the 2012 Neiman Marcus annual report below. You can navigate through the pages in the report by either clicking on the pages listed below, or by using the keyword search tool below to find specific information within the annual report.-
 1
1 -
2
-
3
-
4
-
5
-
6
-
7
-
8
-
9
-
10
-
11
-
12
-
13
-
14
-
 15
15 -
 16
16 -
 17
17 -
 18
18 -
 19
19 -
 20
20 -
 21
21 -
 22
22 -
 23
23 -
 24
24 -
 25
25 -
 26
26 -
 27
27 -
 28
28 -
 29
29 -
 30
30 -
 31
31 -
 32
32 -
 33
33 -
 34
34 -
 35
35 -
36
-
37
-
38
-
39
-
40
-
41
-
42
-
43
-
44
-
45
-
46
-
47
-
48
-
49
-
50
-
51
-
52
-
53
-
54
-
55
-
56
-
57
-
58
-
59
-
60
-
61
-
62
-
63
-
64
-
65
-
66
-
67
-
68
-
69
-
70
-
71
-
72
-
73
-
74
-
75
-
76
-
77
-
78
-
79
-
80
-
81
-
82
-
83
-
84
-
85
-
86
-
87
-
88
-
89
-
90
-
91
-
92
-
93
-
94
-
95
-
96
-
97
-
98
-
99
-
100
-
101
-
102
-
103
-
104
-
105
-
106
-
107
-
108
-
109
-
110
-
111
-
112
-
113
-
114
-
115
-
116
-
117
-
118
-
119
-
120
-
121
-
122
-
123
-
124
-
125
-
126
-
127
-
128
-
129
-
130
-
131
-
132
-
133
-
134
-
135
-
136
-
137
-
138
-
139
-
140
-
141
-
142
-
143
-
144
-
145
-
146
-
147
-
148
-
149
-
150
-
151
-
152
-
153
-
154
-
155
-
156
-
157
-
158
-
159
-
160
-
161
-
162
-
163
-
164
-
165
-
166
-
167
-
168
-
169
-
170
-
171
-
172
-
173
-
174
-
175
-
176
-
177
 |
 |

Table of Contents
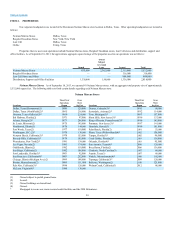
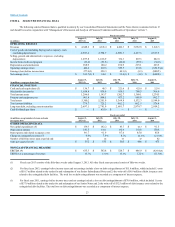
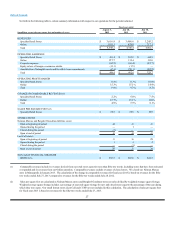
ITEM 6. SELECTED FINANCIAL DATA
The following selected financial data is qualified in entirety by our Consolidated Financial Statements (and the Notes thereto) contained in Item 15
and should be read in conjunction with “Management’s Discussion and Analysis of Financial Condition and Results of Operations” in Item 7.
Fiscal year ended
(in millions)
August 3,
2013 (1)
July 28,
2012
July 30,
2011
July 31,
2010
August 1,
2009
OPERATING RESULTS
Revenues $ 4,648.2 $ 4,345.4 $4,002.3 $3,692.8 $3,643.3
Cost of goods sold including buying and occupancy costs
(excluding depreciation) 2,995.4 2,794.7 2,589.3 2,417.6 2,537.5
Selling, general and administrative expenses (excluding
depreciation) 1,057.8 1,016.9 934.3 887.3 882.0
Income from credit card program (53.4)(51.6)(46.0)(59.1)(50.0)
Depreciation and amortization 188.9 180.2 194.9 215.1 223.5
Operating earnings (loss) 446.4 403.6 329.7 231.8 (652.9)(4)
Earnings (loss) before income taxes 277.4(2) 228.3 49.3(3) (5.3) (888.5)
Net earnings (loss) $ 163.7(2) $140.1 $ 31.6(3) $(1.8) $ (668.0)
(in millions, except per share data)
August 3,
2013 (1)
July 28,
2012
July 30,
2011
July 31,
2010
August 1,
2009
FINANCIAL POSITION
Cash and cash equivalents (5) $ 136.7 $ 49.3 $ 321.6 $ 421.0 $323.4
Merchandise inventories 1,018.8 939.8 839.3 790.5 766.8
Total current assets 1,286.0 1,143.7 1,302.7 1,360.1 1,234.5
Property and equipment, net 901.8 894.5 873.2 905.8 992.7
Total assets 5,300.2 5,201.9 5,364.8 5,532.3 5,594.0
Total current liabilities 776.7 725.2 662.2 662.5 576.4
Long-term debt, excluding current maturities 2,697.1 2,781.9 2,681.7 2,879.7 2,954.2
Cash dividends per share $ — $ 435.0 $ — $ — $ —
Fiscal year ended
(in millions, except number of stores and sales
per square foot)
August 3,
2013 (1)
July 28,
2012
July 30,
2011
July 31,
2010
August 1,
2009
OTHER OPERATING DATA
Net capital expenditures (6) $139.3 $142.2 $83.7 $44.3 $91.5
Depreciation expense 141.5 130.1 132.4 141.8 150.8
Rent expense and related occupancy costs 96.7 91.9 87.6 85.0 85.4
Change in comparable revenues (7) 4.9%7.9%8.1%(0.1)% (21.4)%
Number of full-line stores open at period end 43 44 43 43 42
Sales per square foot (8) $552 $535 $505 $466 $ 475
NON-GAAP FINANCIAL MEASURE
EBITDA (9) $ 635.3 $ 583.8 $ 524.7 $ 446.9 $ (429.4)(4)
EBITDA as a percentage of revenues 13.7%13.4%13.1%12.1%(11.8)%
(1) Fiscal year 2013 consists of the fifty-three weeks ended August 3, 2013. All other fiscal years presented consist of fifty-two weeks.
(2) For fiscal year 2013, earnings before income taxes and net earnings include a loss on debt extinguishment of $15.6 million, which included 1) costs
of $10.7 million related to the tender for and redemption of our Senior Subordinated Notes and 2) the write-off of $4.9 million of debt issuance costs
related to the extinguished debt facilities. The total loss on debt extinguishment was recorded as a component of interest expense.
(3) For fiscal year 2011, earnings before income taxes and net earnings include a loss on debt extinguishment of $70.4 million, which included 1) costs
of $37.9 million related to the tender for and redemption of our Senior Notes and 2) the write-off of $32.5 million of debt issuance costs related to the
extinguished debt facilities. The total loss on debt extinguishment was recorded as a component of interest expense.
23