Memorex 2007 Annual Report Download - page 98
Download and view the complete annual report
Please find page 98 of the 2007 Memorex annual report below. You can navigate through the pages in the report by either clicking on the pages listed below, or by using the keyword search tool below to find specific information within the annual report.-
 1
1 -
2
-
3
-
4
-
5
-
6
-
7
-
8
-
9
-
10
-
11
-
12
-
13
-
14
-
15
-
16
-
17
-
18
-
19
-
20
-
21
-
22
-
23
-
24
-
25
-
26
-
27
-
28
-
29
-
30
-
31
-
32
-
33
-
34
-
35
-
36
-
37
-
38
-
39
-
40
-
41
-
42
-
43
-
44
-
45
-
46
-
47
-
48
-
49
-
50
-
51
-
52
-
53
-
54
-
55
-
56
-
57
-
58
-
59
-
60
-
61
-
62
-
63
-
64
-
65
-
66
-
67
-
68
-
69
-
70
-
71
-
72
-
73
-
74
-
75
-
76
-
77
-
78
-
79
-
80
-
81
-
82
-
83
-
84
-
85
-
86
-
87
-
 88
88 -
 89
89 -
 90
90 -
 91
91 -
 92
92 -
 93
93 -
 94
94 -
 95
95 -
 96
96 -
 97
97 -
 98
98 -
 99
99 -
 100
100 -
 101
101 -
 102
102 -
 103
103 -
 104
104 -
 105
105 -
 106
106 -
 107
107 -
 108
108 -
109
-
110
-
111
-
112
-
113
-
114
-
115
-
116
-
117
-
118
-
119
-
120
-
121
-
122
-
123
-
124
-
125
-
126
-
127
-
128
-
129
 |
 |

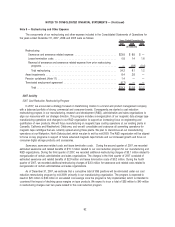
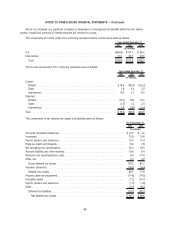
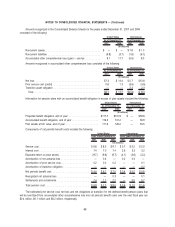
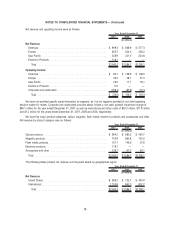
Amounts recognized in the Consolidated Balance Sheets for the years ended December 31, 2007 and 2006
consisted of the following:
2007 2006 2007 2006
As of December 31, As of December 31,
United States International
(In millions)
Noncurrent assets . . . . . . . . . . . . . . . . . . . . . . . . . . . . . . . . . . . . . $ — $ — $ 7.8 $ 1.0
Noncurrent liabilities . . . . . . . . . . . . . . . . . . . . . . . . . . . . . . . . . . . (5.9) (3.7) (1.8) (6.1)
Accumulated other comprehensive loss (gain) — pre-tax . . . . . . . . . . 8.1 11.7 (0.6) 9.3
Amounts recognized in accumulated other comprehensive loss consisted of the following:
2007 2006 2007 2006
As of December 31, As of December 31,
United States International
(In millions)
Net loss . . . . . . . . . . . . . . . . . . . . . . . . . . . . . . . . . . . . . . . . . . . . $7.3 $ 10.4 $ 0.7 $10.6
Prior service cost (credit) . . . . . . . . . . . . . . . . . . . . . . . . . . . . . . . . 0.8 1.3 (3.6) (3.6)
Transition asset obligation . . . . . . . . . . . . . . . . . . . . . . . . . . . . . . . — — 2.3 2.3
Total . . . . . . . . . . . . . . . . . . . . . . . . . . . . . . . . . . . . . . . . . . . . $8.1 $ 11.7 $(0.6) $ 9.3
Information for pension plans with an accumulated benefit obligation in excess of plan assets included the following:
2007 2006 2007 2006
As of December 31, As of December 31,
United States International
(In millions)
Projected benefit obligation, end of year . . . . . . . . . . . . . . . . . . . . $117.5 $131.9 $ — $59.6
Accumulated benefit obligation, end of year . . . . . . . . . . . . . . . . . . 116.2 131.2 — 58.9
Plan assets at fair value, end of year . . . . . . . . . . . . . . . . . . . . . . 111.6 128.2 — 53.5
Components of net periodic benefit costs included the following:
2007 2006 2005 2007 2006 2005
Years Ended December 31, Years Ended December 31,
United States International
(In millions)
Service cost . . . . . . . . . . . . . . . . . . . . . . . . . . . . . . . . . $ 6.6 $ 8.3 $ 9.1 $ 0.7 $ 0.5 $ 0.5
Interest cost . . . . . . . . . . . . . . . . . . . . . . . . . . . . . . . . . 7.4 7.0 7.4 3.6 3.3 3.2
Expected return on plan assets . . . . . . . . . . . . . . . . . . . . (9.7) (9.8) (9.7) (4.1) (3.6) (3.2)
Amortization of net actuarial loss . . . . . . . . . . . . . . . . . . . — 0.4 — 0.2 0.3 —
Amortization of prior service cost. . . . . . . . . . . . . . . . . . . 0.2 0.2 0.2 — — 0.1
Amortization of transition obligation . . . . . . . . . . . . . . . . . —————0.2
Net periodic benefit cost . . . . . . . . . . . . . . . . . . . . . . . . . $ 4.5 $ 6.1 $ 7.0 $ 0.4 $ 0.5 $ 0.8
Recognized net actuarial loss . . . . . . . . . . . . . . . . . . . . . — — 0.3 — — 0.1
Settlements and curtailments . . . . . . . . . . . . . . . . . . . . . 2.4 1.2 2.2 — 0.5 0.7
Total pension cost . . . . . . . . . . . . . . . . . . . . . . . . . . . . . $ 6.9 $ 7.3 $ 9.5 $ 0.4 $ 1.0 $ 1.6
The estimated prior service cost, net loss and net obligations at transition for the defined benefit pension plans that
will be amortized from accumulated other comprehensive loss into net periodic benefit costs over the next fiscal year are
$0.4 million, $0.1 million and $6.2 million, respectively.
69
NOTES TO CONSOLIDATED FINANCIAL STATEMENTS — (Continued)