Memorex 2007 Annual Report Download - page 49
Download and view the complete annual report
Please find page 49 of the 2007 Memorex annual report below. You can navigate through the pages in the report by either clicking on the pages listed below, or by using the keyword search tool below to find specific information within the annual report.-
 1
1 -
2
-
3
-
4
-
5
-
6
-
7
-
8
-
9
-
10
-
11
-
12
-
13
-
14
-
15
-
16
-
17
-
18
-
19
-
20
-
21
-
22
-
23
-
24
-
25
-
26
-
27
-
28
-
29
-
30
-
31
-
32
-
33
-
34
-
35
-
36
-
37
-
38
-
 39
39 -
 40
40 -
 41
41 -
 42
42 -
 43
43 -
 44
44 -
 45
45 -
 46
46 -
 47
47 -
 48
48 -
 49
49 -
 50
50 -
 51
51 -
 52
52 -
 53
53 -
 54
54 -
 55
55 -
 56
56 -
 57
57 -
 58
58 -
 59
59 -
60
-
61
-
62
-
63
-
64
-
65
-
66
-
67
-
68
-
69
-
70
-
71
-
72
-
73
-
74
-
75
-
76
-
77
-
78
-
79
-
80
-
81
-
82
-
83
-
84
-
85
-
86
-
87
-
88
-
89
-
90
-
91
-
92
-
93
-
94
-
95
-
96
-
97
-
98
-
99
-
100
-
101
-
102
-
103
-
104
-
105
-
106
-
107
-
108
-
109
-
110
-
111
-
112
-
113
-
114
-
115
-
116
-
117
-
118
-
119
-
120
-
121
-
122
-
123
-
124
-
125
-
126
-
127
-
128
-
129
 |
 |
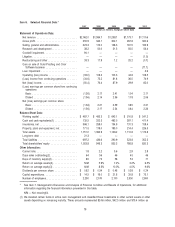
of December 31, 2005, 2004 and 2003, respectively, in addition to cash and equivalents. These investments have since
matured, which resulted in no active cash management investment balance for the years ended December 31, 2007
and 2006.
(2) These operational measures, which we regularly use, are provided to assist in the investor’s further understanding of
our operations. Days sales outstanding is calculated using the count-back method, which calculates the number of
days of most recent revenue that are reflected in the net accounts receivable balance. Days of inventory supply is cal-
culated using the current period inventory balance divided by the average of the inventoriable portion of cost of goods
sold for the previous 12 months, expressed in days.
(3) Return percentages are calculated using income from continuing operations. Our 2007 loss from continuing operations
resulted in return percentages that are not meaningful.
Item 7. Management’s Discussion and Analysis of Financial Condition and Results of Operations.
The following discussion should be read in conjunction with the Consolidated Financial Statements and the related
notes that appear elsewhere in this Annual Report on Form 10-K.
Overview
Imation is a leading provider of removable data storage media products designed to help our customers capture,
create, protect, preserve and retrieve valuable digital assets. Our data storage products are sold in approximately 100
countries to commercial organizations and individual consumers. Our commercial customers range from managers of large
data centers to distributed network administrators to small business owners who rely on our tape cartridges for data
processing, security, business continuity, backup and archiving applications. Our commercial and consumer customers rely
on our recordable optical discs, USB flash drives, flash cards, removable hard drives and audio and video tape to store,
edit and manage data, photos, video, images and music. We also sell a range of consumer video, audio and home
electronic products through retailers in North America.
The data storage market presents attractive growth opportunities as well as challenges. Demand for removable data
storage capacity is growing rapidly. New formats deliver greater capacity in a single piece of storage media, which results
in overall revenue growth being lower than the overall growth in demand for storage capacity. The market is highly
competitive, may be subject to consolidation and is characterized by continuing changes in technology, ongoing variable
price erosion, diverse distribution channels and a large variety of brands and formats for tape, optical, flash and removable
hard disk products. In 2007, we entered into the consumer electronics market with our Electronic Products segment. The
consumer electronics and accessories markets provide growth opportunities to extend our various brands across multiple
product categories.
We deliver a broad portfolio of products across multiple brands through diverse distribution channels and geographies.
We manufacture the majority of our magnetic tape products and source the majority of our other products. Success in the
market is dependent on several factors, including being early to market with new formats and products; having efficient
manufacturing, sourcing, logistics and supply chain operations; working closely with leading OEMs to develop new formats
or enhancements to existing formats; offering a broad assortment of products; having broad geographic and market
coverage and managing a portfolio of strong brands across diverse regions, distribution channels and product categories.
Our strategy, as stated in our May 22, 2007 analyst presentation, is to optimize our magnetic tape business, to grow
our consumer business and to extend our brands into new areas such as audio/video consumer electronic products and
accessory products. This strategy provides significant growth opportunities for us; however, the consumer markets are
subject to greater volatility in pricing and are more difficult to predict than the commercial data storage tape market in
which we have historically operated. Specifically to our strategy, we are optimizing our position in magnetic tape as we
continue to invest in both technology and manufacturing of current and future tape formats. We are growing our consumer
products portfolio across multiple brands and extending brands selectively into the audio/video consumer electronics arena.
Lastly, with our recent acquisitions and other strategic actions, we are building a portfolio of brands that we own, manage
or distribute in both consumer retail and commercial markets.
Our plan is to grow revenue organically, through distribution agreements and other strategic actions, and also through
strategic mergers and acquisitions. We will do this without adding significant additional infrastructure. We continually
20