Memorex 2007 Annual Report Download - page 54
Download and view the complete annual report
Please find page 54 of the 2007 Memorex annual report below. You can navigate through the pages in the report by either clicking on the pages listed below, or by using the keyword search tool below to find specific information within the annual report.-
 1
1 -
2
-
3
-
4
-
5
-
6
-
7
-
8
-
9
-
10
-
11
-
12
-
13
-
14
-
15
-
16
-
17
-
18
-
19
-
20
-
21
-
22
-
23
-
24
-
25
-
26
-
27
-
28
-
29
-
30
-
31
-
32
-
33
-
34
-
35
-
36
-
37
-
38
-
39
-
40
-
41
-
42
-
43
-
 44
44 -
 45
45 -
 46
46 -
 47
47 -
 48
48 -
 49
49 -
 50
50 -
 51
51 -
 52
52 -
 53
53 -
 54
54 -
 55
55 -
 56
56 -
 57
57 -
 58
58 -
 59
59 -
 60
60 -
 61
61 -
 62
62 -
 63
63 -
 64
64 -
65
-
66
-
67
-
68
-
69
-
70
-
71
-
72
-
73
-
74
-
75
-
76
-
77
-
78
-
79
-
80
-
81
-
82
-
83
-
84
-
85
-
86
-
87
-
88
-
89
-
90
-
91
-
92
-
93
-
94
-
95
-
96
-
97
-
98
-
99
-
100
-
101
-
102
-
103
-
104
-
105
-
106
-
107
-
108
-
109
-
110
-
111
-
112
-
113
-
114
-
115
-
116
-
117
-
118
-
119
-
120
-
121
-
122
-
123
-
124
-
125
-
126
-
127
-
128
-
129
 |
 |

North Dakota and Camarillo, California production facilities. We also incurred asset impairment charges of $2.8 million
related to the abandonment of certain manufacturing assets and purchased intellectual property.
In 2005, we recorded net restructuring charges of $1.2 million primarily for costs associated with the Tucson, Arizona
production facility closing.
See Note 9 to the Consolidated Financial Statements for further information regarding our various restructuring
programs and other expenses.
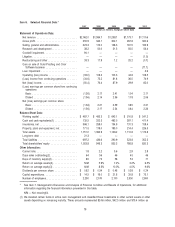
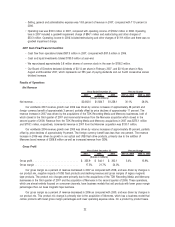
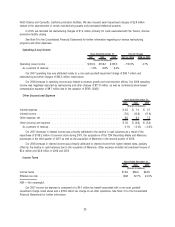
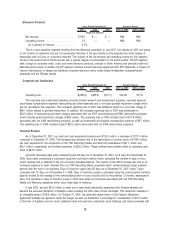
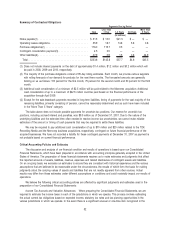
Operating (Loss) Income
2007 2006 2005 2007 vs. 2006 2006 vs. 2005
(Dollars in millions)
Years Ended December 31, Percent Change
Operating (loss) income . . . . . . . . . . . . . . . . . . . . . . . . . . $(33.0) $108.2 $103.3 ⫺130.5% 4.7%
As a percent of revenue . . . . . . . . . . . . . . . . . . . . . . . . ⫺1.6% 6.8% 8.2%
Our 2007 operating loss was attributed mainly to a non-cash goodwill impairment charge of $94.1 million and
restructuring and other charges of $33.3 million noted above.
Our 2006 increase in operating income was related to revenue growth and cost reduction efforts. Our 2006 operating
income was negatively impacted by restructuring and other charges of $11.9 million, as well as incremental stock-based
compensation expense of $9.7 million due to the adoption of SFAS 123(R).
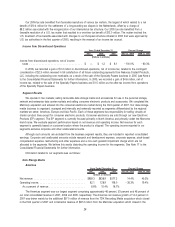
Other (Income) and Expense
2007 2006 2005
(Dollars in millions)
Years Ended December 31,
Interest expense. . . . . . . . . . . . . . . . . . . . . . . . . . . . . . . . . . . . . . . . . . . . . . . . . . . . . . . $ 2.6 $ 1.0 $ 0.7
Interest income . . . . . . . . . . . . . . . . . . . . . . . . . . . . . . . . . . . . . . . . . . . . . . . . . . . . . . . (7.6) (12.6) (11.6)
Other expense, net . . . . . . . . . . . . . . . . . . . . . . . . . . . . . . . . . . . . . . . . . . . . . . . . . . . . . 6.6 8.0 7.5
Other (income) and expense . . . . . . . . . . . . . . . . . . . . . . . . . . . . . . . . . . . . . . . . . . . . . . $ 1.6 $ (3.6) $ (3.4)
As a percent of revenue . . . . . . . . . . . . . . . . . . . . . . . . . . . . . . . . . . . . . . . . . . . . . . . 0.1% —0.2% —0.3%
Our 2007 decrease in interest income was primarily attributed to the decline in cash balances as a result of the
repurchase of $108.2 million of common stock during 2007, the acquisitions of the TDK Recording Media and Memcorp
businesses in the third quarter of 2007 as well as the acquisition of Memorex in the second quarter of 2006.
Our 2006 increase in interest income was primarily attributed to interest income from higher interest rates, partially
offset by the decline in cash balances due to the acquisition of Memorex. Other expense included net investment losses of
$3.4 million and $2.6 million in 2006 and 2005.
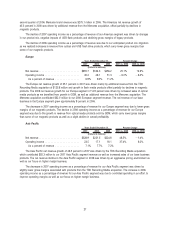
Income Taxes
2007 2006 2005
(Dollars in millions)
Years Ended December 31,
Income taxes . . . . . . . . . . . . . . . . . . . . . . . . . . . . . . . . . . . . . . . . . . . . . . . . . . . . . . . . $15.8 $36.6 $24.9
Effective tax rate . . . . . . . . . . . . . . . . . . . . . . . . . . . . . . . . . . . . . . . . . . . . . . . . . . . . . . N/M 32.7% 23.3%
N/M — Not meaningful.
Our 2007 income tax expense is comprised of a $4.0 million tax benefit associated with a non-cash goodwill
impairment charge noted above and a $19.8 million tax charge on all other operations. See Note 10 to the Consolidated
Financial Statements for further information.
25