Memorex 2007 Annual Report Download - page 107
Download and view the complete annual report
Please find page 107 of the 2007 Memorex annual report below. You can navigate through the pages in the report by either clicking on the pages listed below, or by using the keyword search tool below to find specific information within the annual report.
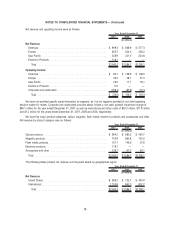
Net revenue and operating income were as follows:
2007 2006 2005
Years Ended December 31,
(In millions)
Net Revenue
Americas . . . . . . . . . . . . . . . . . . . . . . . . . . . . . . . . . . . . . . . . . . . . . $ 959.3 $ 838.9 $ 577.3
Europe . . . . . . . . . . . . . . . . . . . . . . . . . . . . . . . . . . . . . . . . . . . . . . 655.7 524.3 456.2
Asia Pacific . . . . . . . . . . . . . . . . . . . . . . . . . . . . . . . . . . . . . . . . . . . 328.9 221.5 224.6
Electronic Products . . . . . . . . . . . . . . . . . . . . . . . . . . . . . . . . . . . . . . 118.1 — —
Total . . . . . . . . . . . . . . . . . . . . . . . . . . . . . . . . . . . . . . . . . . . . . . $2,062.0 $1,584.7 $1,258.1
Operating Income
Americas . . . . . . . . . . . . . . . . . . . . . . . . . . . . . . . . . . . . . . . . . . . . . $ 82.1 $ 128.9 $ 108.0
Europe . . . . . . . . . . . . . . . . . . . . . . . . . . . . . . . . . . . . . . . . . . . . . . 45.2 48.1 51.3
Asia Pacific . . . . . . . . . . . . . . . . . . . . . . . . . . . . . . . . . . . . . . . . . . . 23.5 17.1 16.1
Electronic Products . . . . . . . . . . . . . . . . . . . . . . . . . . . . . . . . . . . . . . 5.5 — —
Corporate and unallocated . . . . . . . . . . . . . . . . . . . . . . . . . . . . . . . . . (189.3) (85.9) (72.1)
Total . . . . . . . . . . . . . . . . . . . . . . . . . . . . . . . . . . . . . . . . . . . . . . $ (33.0) $ 108.2 $ 103.3
We have not provided specific asset information by segment, as it is not regularly provided to our chief operating
decision maker for review. Corporate and unallocated amounts above include a non-cash goodwill impairment charge of
$94.1 million for the year ended December 31, 2007 as well as restructuring and other costs of $33.3 million, $11.9 million
and $1.2 million for the years ended December 31, 2007, 2006 and 2005, respectively.
We have five major product categories: optical, magnetic, flash media, electronic products and accessories and other.
Net revenue by product category was as follows:
2007 2006 2005
Years Ended December 31,
(In millions)
Optical products . . . . . . . . . . . . . . . . . . . . . . . . . . . . . . . . . . . . . . . . . . $ 954.2 $ 680.3 $ 450.7
Magnetic products. . . . . . . . . . . . . . . . . . . . . . . . . . . . . . . . . . . . . . . . . 703.9 660.8 700.5
Flash media products . . . . . . . . . . . . . . . . . . . . . . . . . . . . . . . . . . . . . . 157.1 146.6 57.8
Electronic products . . . . . . . . . . . . . . . . . . . . . . . . . . . . . . . . . . . . . . . . 118.1 — —
Accessories and other . . . . . . . . . . . . . . . . . . . . . . . . . . . . . . . . . . . . . . 128.7 97.0 49.1
Total . . . . . . . . . . . . . . . . . . . . . . . . . . . . . . . . . . . . . . . . . . . . . . . . $2,062.0 $1,584.7 $1,258.1
The following tables present net revenue and long-lived assets by geographical region:
2007 2006 2005
Years Ended December 31,
(In millions)
Net Revenue
United States . . . . . . . . . . . . . . . . . . . . . . . . . . . . . . . . . . . . . . . . . . $ 958.2 $ 722.7 $ 450.9
International . . . . . . . . . . . . . . . . . . . . . . . . . . . . . . . . . . . . . . . . . . . 1,103.8 862.0 807.2
Total . . . . . . . . . . . . . . . . . . . . . . . . . . . . . . . . . . . . . . . . . . . . . . $2,062.0 $1,584.7 $1,258.1
78
NOTES TO CONSOLIDATED FINANCIAL STATEMENTS — (Continued)


