Memorex 2007 Annual Report Download - page 28
Download and view the complete annual report
Please find page 28 of the 2007 Memorex annual report below. You can navigate through the pages in the report by either clicking on the pages listed below, or by using the keyword search tool below to find specific information within the annual report.-
 1
1 -
2
-
3
-
4
-
5
-
6
-
7
-
8
-
9
-
10
-
11
-
12
-
13
-
14
-
15
-
16
-
17
-
 18
18 -
 19
19 -
 20
20 -
 21
21 -
 22
22 -
 23
23 -
 24
24 -
 25
25 -
 26
26 -
 27
27 -
 28
28 -
 29
29 -
 30
30 -
 31
31 -
 32
32 -
 33
33 -
 34
34 -
 35
35 -
 36
36 -
 37
37 -
 38
38 -
39
-
40
-
41
-
42
-
43
-
44
-
45
-
46
-
47
-
48
-
49
-
50
-
51
-
52
-
53
-
54
-
55
-
56
-
57
-
58
-
59
-
60
-
61
-
62
-
63
-
64
-
65
-
66
-
67
-
68
-
69
-
70
-
71
-
72
-
73
-
74
-
75
-
76
-
77
-
78
-
79
-
80
-
81
-
82
-
83
-
84
-
85
-
86
-
87
-
88
-
89
-
90
-
91
-
92
-
93
-
94
-
95
-
96
-
97
-
98
-
99
-
100
-
101
-
102
-
103
-
104
-
105
-
106
-
107
-
108
-
109
-
110
-
111
-
112
-
113
-
114
-
115
-
116
-
117
-
118
-
119
-
120
-
121
-
122
-
123
-
124
-
125
-
126
-
127
-
128
-
129
 |
 |

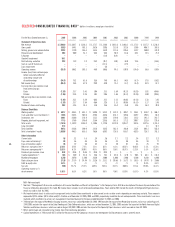
N/M - Not meaningful
* See Item 7 “Management’s Discussion and Analysis of Financial Condition and Results of Operations” in the Company’s Form 10-K for a description of the basis of presentation of the
financial information presented in this table. Net income (loss) includes results of discontinued operations. Years prior to 2001 include the results of the Specialty Papers business,
which was sold on June 30, 2005.
(1) We invested certain funds in active cash management and classified those investments in other current assets or other assets depending on remaining maturity. These amounts
represented $24.6 million, $42.5 million and $13.4 million as of December 31, 2005, 2004 and 2003, respectively, in addition to cash and equivalents. These investments have since
matured, which resulted in no active cash management investment balance for the years ended December 31, 2007 and 2006.
(2) 1998 excludes the impact of the Medical Imaging business, which was sold on November 30, 1998. 1999 excludes the impact of the Photo Color business, which was sold on August 2,
1999. 2001 excludes the impact of the Color Proofing and Color Software business, which was sold on December 31, 2001. 2002 excludes the impact of the North American Digital
Solutions and Services business, which was sold on August 30, 2002. 2005 excludes the impact of the Specialty Papers business, which was sold on June 30, 2005.
(3) Return percentages are calculated using income (loss) from continuing operations.
(4) Capital expenditures in 1998 include $67.5 million for the purchase of the Company’s research and development facility previously under a synthetic lease.
SELECTED CONSOLIDATED FINANCIAL DATA* (dollars in millions, except per share data)
05
For the Years Ended December 31, 2007 2006 2005 2004 2003 2002 2001 2000 1999 1998
Statement of Operations Data
Net revenue $ 2,062.0 $ 1,584.7 $ 1,258.1 $ 1,173.7 $ 1,110.6 $ 1,013.6 $ 1,068.3 $ 1,171.3 $ 1,337.2 $ 1,236.4
Gross profit 355.9 344.1 302.1 287.8 320.6 313.0 323.5 339.0 408.3 387.6
Selling, general and administrative 223.3 174.0 146.3 161.5 163.9 173.6 226.5 312.7 280.0 347.0
Research and development 38.2 50.0 51.3 56.5 56.4 50.5 61.8 64.1 72.5 77.2
Litigation – – – – (1.0) (6.4) – – – –
Goodwill impairment 94.1
Restructuring and other 33.3 11.9 1.2 25.2 (0.7) (4.0) 48.0 21.8 – (16.6)
Gain on sale of businesses – – – – (11.1) – (1.9) – – –
Loan impairment – – – – 4.6 – – – – –
Operating income (33.0) 108.2 103.3 44.6 108.5 99.3 (10.9) (59.6) 55.8 (19.9)
Income (loss) from continuing ops
before cumulative effect of
accounting change and
discontinued ops (34.6) 75.2 81.8 36.5 74.9 66.1 (4.6) (8.7) 37.6 (18.2)
Net income (loss) (50.4) 76.4 87.9 29.9 82.0 75.1 (1.7) (4.4) 43.9 57.1
Earnings (loss) per common share
from continuing ops:
Basic (1.36) 2.17 2.41 1.04 2.11 1.89 (0.13) (0.25) 1.01 (0.46)
Diluted (1.36) 2.14 2.36 1.03 2.06 1.86 (0.13) (0.25) 1.00 (0.46)
Net earnings (loss) per common share:
Basic (1.36) 2.21 2.59 0.85 2.31 2.15 (0.05) (0.13) 1.18 1.45
Diluted (1.36) 2.17 2.54 0.84 2.26 2.11 (0.05) (0.13) 1.17 1.45
Number of shares outstanding 38.2 34.8 34.3 33.8 35.5 35.4 35.0 34.6 36.4 39.9
Balance Sheet Data
Working capital $ 487.7 $ 485.3 $ 643.1 $ 510.8 $ 541.2 $ 532.2 $ 409.7 $ 395.1 $ 414.2 $ 506.7
Cash and other cash investments (1) 135.5 252.5 507.6 439.6 424.8 474.7 389.8 269.7 194.6 64.2
Inventories, net 366.1 258.0 134.9 131.3 159.4 139.0 130.3 141.2 191.3 263.7
Property, plant and equipment, net 171.5 178.0 195.0 214.4 226.5 181.5 171.2 200.7 212.8 233.8
Total assets 1,751.0 1,382.9 1,146.2 1,110.6 1,172.8 1,119.9 1,053.7 987.6 1,127.6 1,313.3
Long-term debt 21.3 – – – – – – – 1.1 32.7
Total liabilities 697.2 436.6 290.9 323.8 352.5 381.4 398.0 325.4 402.3 552.2
Total shareholders’ equity 1,053.8 946.3 855.3 786.8 820.3 738.5 655.7 662.5 725.3 761.1
Other Information
Current ratio 1.8 2.2 3.6 2.9 2.8 2.7 2.2 2.4 2.2 2.2
Days sales outstanding (2) 64 56 46 45 46 43 48 48 59 77
Days of inventory supply (2) 65 72 56 53 71 70 67 63 76 97
Return on average assets (3) (2.2)% 5.9% 7.2% 3.2% 6.5% 6.1% (0.5)% (0.8)% 3.1% (1.2)%
Return on average equity (3) (3.5)% 8.3% 10.0% 4.5% 9.6% 9.5% (0.7)% (1.3)% 5.1% (2.5)%
Dividends per common share $ 0.62 $ 0.54 $ 0.46 $ 0.38 $ 0.24 $ – $ – $ – $ – $ –
Capital expenditures (4) 14.5 $ 16.0 $ 21.6 $ 35.8 $ 75.1 $ 42.6 $ 47.0 $ 50.5 $ 64.1 $ 132.4
Number of employees 2,250 2,070 2,100 2,550 2,800 2,800 3,400 4,300 4,850 6,400
Book value per share 27.59 $ 27.19 $ 24.94 $ 23.28 $ 23.11 $ 20.86 $ 18.73 $ 19.15 $ 19.93 $ 19.08
Debt to equity ratio 3.0% -% -% -% -% -% -% -% 0.2% 4.3%
Tax rate N/M 32.7% 23.3% 16.9% 32.5% 34.7% 60.0% 77.6% 39.0% 41.1%
Operating income as %
of net revenue (1.6)% 6.8% 8.2% 3.8% 9.8% 9.8% (1.0%) (5.1%) 4.2% (1.6%)