Memorex 2007 Annual Report Download - page 51
Download and view the complete annual report
Please find page 51 of the 2007 Memorex annual report below. You can navigate through the pages in the report by either clicking on the pages listed below, or by using the keyword search tool below to find specific information within the annual report.-
 1
1 -
2
-
3
-
4
-
5
-
6
-
7
-
8
-
9
-
10
-
11
-
12
-
13
-
14
-
15
-
16
-
17
-
18
-
19
-
20
-
21
-
22
-
23
-
24
-
25
-
26
-
27
-
28
-
29
-
30
-
31
-
32
-
33
-
34
-
35
-
36
-
37
-
38
-
39
-
40
-
 41
41 -
 42
42 -
 43
43 -
 44
44 -
 45
45 -
 46
46 -
 47
47 -
 48
48 -
 49
49 -
 50
50 -
 51
51 -
 52
52 -
 53
53 -
 54
54 -
 55
55 -
 56
56 -
 57
57 -
 58
58 -
 59
59 -
 60
60 -
 61
61 -
62
-
63
-
64
-
65
-
66
-
67
-
68
-
69
-
70
-
71
-
72
-
73
-
74
-
75
-
76
-
77
-
78
-
79
-
80
-
81
-
82
-
83
-
84
-
85
-
86
-
87
-
88
-
89
-
90
-
91
-
92
-
93
-
94
-
95
-
96
-
97
-
98
-
99
-
100
-
101
-
102
-
103
-
104
-
105
-
106
-
107
-
108
-
109
-
110
-
111
-
112
-
113
-
114
-
115
-
116
-
117
-
118
-
119
-
120
-
121
-
122
-
123
-
124
-
125
-
126
-
127
-
128
-
129
 |
 |

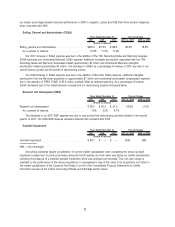
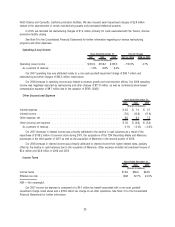
• Selling, general and administrative expense was 10.8 percent of revenue in 2007, compared with 11.0 percent in
2006.
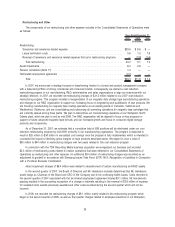
• Operating loss was $33.0 million in 2007, compared with operating income of $108.2 million in 2006. Operating
loss in 2007 included a goodwill impairment charge of $94.1 million and restructuring and other charges of
$33.3 million. Operating income in 2006 included restructuring and other charges of $11.9 million and there was no
goodwill impairment charge.
2007 Cash Flow/Financial Condition
• Cash flow from operations totaled $87.5 million in 2007, compared with $97.5 million in 2006.
• Cash and liquid investments totaled $135.5 million at year-end.
• We repurchased approximately 3.8 million shares of common stock in the year for $108.2 million.
• Our Board of Directors declared dividends of $0.14 per share in February 2007, and $0.16 per share in May,
August and November 2007, which represents our fifth year of paying dividends and our fourth consecutive annual
dividend increase.
Results of Operations
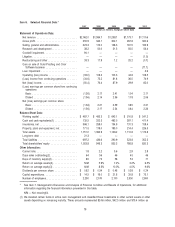
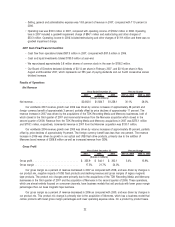
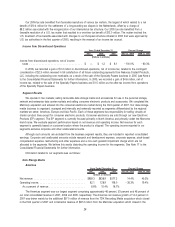
Net Revenue
2007 2006 2005 2007 vs. 2006 2006 vs. 2005
Years Ended December 31, Percent Change
(Dollars in millions)
Net revenue. . . . . . . . . . . . . . . . . . . . . . . . . . . . . . . $2,062.0 $1,584.7 $1,258.1 30.1% 26.0%
Our worldwide 2007 revenue growth over 2006 was driven by volume increases of approximately 38 percent and
foreign currency benefit of approximately 3 percent, partially offset by price declines of approximately 11 percent. The
revenue increase in 2007 was driven by the acquisitions of the TDK Recording Media and Memcorp businesses, both of
which closed in the third quarter of 2007 and incremental revenue from the Memorex acquisition which closed in the
second quarter of 2006. Revenue from the TDK Recording Media and Memcorp acquisitions in 2007 was $275.1 million
and $118.1 million, respectively. Incremental revenue in 2007 from the Memorex acquisition was $130.1 million.
Our worldwide 2006 revenue growth over 2005 was driven by volume increases of approximately 35 percent, partially
offset by price declines of approximately 9 percent. The foreign currency benefit was less than one percent. The revenue
increase in 2006 was driven by growth in our optical and USB flash drive products, primarily due to the addition of
Memorex brand revenue of $308.8 million as well as increased revenue from GDM.
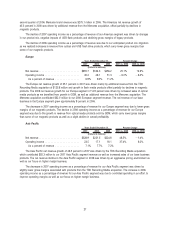
Gross Profit
2007 2006 2005 2007 vs. 2006 2006 vs. 2005
Years Ended December 31, Percent Change
(Dollars in millions)
Gross profit . . . . . . . . . . . . . . . . . . . . . . . . . . . . . . $ 355.9 $ 344.1 $ 302.1 3.4% 13.9%
Gross margin . . . . . . . . . . . . . . . . . . . . . . . . . . . . . 17.3% 21.7% 24.0%
Our gross margin as a percent of revenue decreased in 2007 as compared with 2006, and was driven by changes in
our product mix, negative impacts of USB flash products and declining revenue and gross margins of legacy magnetic
tape products. The product mix changes were primarily due to the acquisitions of the TDK Recording Media and Memcorp
businesses in the third quarter of 2007 and the acquisition of Memorex in the second quarter of 2006. These operations,
which are almost entirely focused on consumer channels, have business models that sell products with lower gross margin
percentages than our base magnetic tape business.
Our gross margin as a percent of revenue decreased in 2006 as compared with 2005, and was driven by changes in
our product mix. This product mix change is primarily due to the acquisition of Memorex, which has a business model that
carries products with lower gross margin percentages and lower operating expense ratios. On a product by product basis,
22