Logitech 2006 Annual Report Download - page 98
Download and view the complete annual report
Please find page 98 of the 2006 Logitech annual report below. You can navigate through the pages in the report by either clicking on the pages listed below, or by using the keyword search tool below to find specific information within the annual report.-
 1
1 -
2
-
3
-
4
-
5
-
6
-
7
-
8
-
9
-
10
-
11
-
12
-
13
-
14
-
15
-
16
-
17
-
18
-
19
-
20
-
21
-
22
-
23
-
24
-
25
-
26
-
27
-
28
-
29
-
30
-
31
-
32
-
33
-
34
-
35
-
36
-
37
-
38
-
39
-
40
-
41
-
42
-
43
-
44
-
45
-
46
-
47
-
48
-
49
-
50
-
51
-
52
-
53
-
54
-
55
-
56
-
57
-
58
-
59
-
60
-
61
-
62
-
63
-
64
-
65
-
66
-
67
-
68
-
69
-
70
-
71
-
72
-
73
-
74
-
75
-
76
-
77
-
78
-
79
-
80
-
81
-
82
-
83
-
84
-
85
-
86
-
87
-
 88
88 -
 89
89 -
 90
90 -
 91
91 -
 92
92 -
 93
93 -
 94
94 -
 95
95 -
 96
96 -
 97
97 -
 98
98 -
 99
99 -
 100
100 -
 101
101 -
 102
102 -
 103
103 -
 104
104 -
 105
105 -
 106
106 -
 107
107 -
 108
108 -
109
-
110
-
111
-
112
-
113
-
114
-
115
-
116
-
117
-
118
-
119
-
120
-
121
-
122
-
123
-
124
-
125
-
126
-
127
-
128
-
129
-
130
-
131
-
132
-
133
-
134
-
135
-
136
-
137
-
138
-
139
-
140
-
141
-
142
-
143
-
144
-
145
-
146
-
147
-
148
-
149
-
150
-
151
-
152
-
153
-
154
-
155
-
156
-
157
-
158
-
159
-
160
-
161
-
162
 |
 |

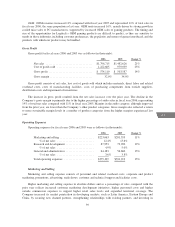
additional marketing initiatives. In addition, the Company’s operating expenses benefited from the strengthening
of the U.S. dollar relative to the Euro and Swiss franc due to exchange rate changes on translation to the U.S.
dollar financial statements.
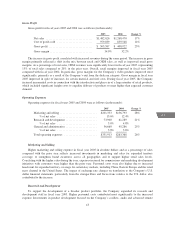
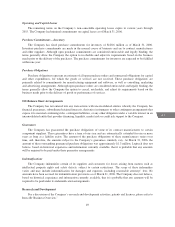
Research and Development
Research and development expense consists of personnel and related overhead costs, contractors and outside
consultants, supplies and materials, equipment depreciation and facilities costs, all associated with the design and
development of new products and enhancements of existing products.
The increase in research and development expense reflects the Company’s commitment to continued
investments in research and product development efforts. Investments in audio, video and remote control groups
were the most significant contributors to the increase, driven by higher headcount and related personnel costs, as
well as higher prototyping expenses. The impact of exchange rate changes on translation to the Company’s U.S.
dollar financial statements was not material.
General and Administrative
General and administrative expense consists primarily of personnel and related overhead and facilities costs
for the finance, information systems, executive, human resources and legal functions.
General and administrative expense increased primarily as a result of increased headcount to support the
business growth. In addition, costs incurred for Sarbanes-Oxley consultation and implementation and for process
changes occurring in the Company contributed to the higher general and administrative expense. The Company’s
operating expenses also benefited from the strengthening of the U.S. dollar relative to the Euro and Swiss franc
due to exchange rate changes on translation to the U.S. dollar financial statements.
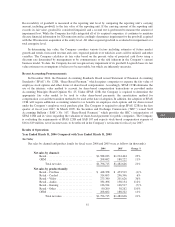
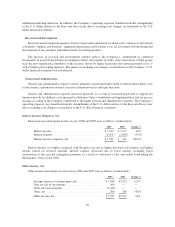
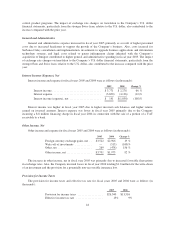
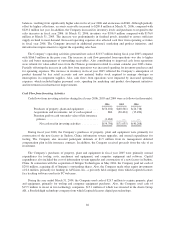
Interest Income (Expense), Net
Interest income and expense for fiscal years 2006 and 2005 were as follows (in thousands):
2006 2005 Change %
Interest income .................................. $5,512 $3,771 46%
Interest expense ................................. (1,921) (3,630) (47)%
Interest income (expense), net ...................... $3,591 $ 141 2447%
Interest income was higher compared with the prior year due to higher invested cash balances and higher
returns earned on invested amounts. Interest expense decreased due to lower interest, including lower
amortization of the accreted redemption premium, as a result of conversion of the convertible bond during the
third quarter of fiscal year 2006.
Other Income, Net
Other income and expense for fiscal years 2006 and 2005 were as follows (in thousands):
2006 2005 Change %
Foreign currency exchange gains, net ................. $7,580 $3,522 115%
Gain on sale of investments ......................... 560 — —
Write-off of investments ........................... (1,168) — —
Other,net ....................................... 380 269 (41)%
Otherincome,net ................................ $7,352 $3,791 94%
40