Logitech 2006 Annual Report Download - page 101
Download and view the complete annual report
Please find page 101 of the 2006 Logitech annual report below. You can navigate through the pages in the report by either clicking on the pages listed below, or by using the keyword search tool below to find specific information within the annual report.-
 1
1 -
2
-
3
-
4
-
5
-
6
-
7
-
8
-
9
-
10
-
11
-
12
-
13
-
14
-
15
-
16
-
17
-
18
-
19
-
20
-
21
-
22
-
23
-
24
-
25
-
26
-
27
-
28
-
29
-
30
-
31
-
32
-
33
-
34
-
35
-
36
-
37
-
38
-
39
-
40
-
41
-
42
-
43
-
44
-
45
-
46
-
47
-
48
-
49
-
50
-
51
-
52
-
53
-
54
-
55
-
56
-
57
-
58
-
59
-
60
-
61
-
62
-
63
-
64
-
65
-
66
-
67
-
68
-
69
-
70
-
71
-
72
-
73
-
74
-
75
-
76
-
77
-
78
-
79
-
80
-
81
-
82
-
83
-
84
-
85
-
86
-
87
-
88
-
89
-
90
-
 91
91 -
 92
92 -
 93
93 -
 94
94 -
 95
95 -
 96
96 -
 97
97 -
 98
98 -
 99
99 -
 100
100 -
 101
101 -
 102
102 -
 103
103 -
 104
104 -
 105
105 -
 106
106 -
 107
107 -
 108
108 -
 109
109 -
 110
110 -
 111
111 -
112
-
113
-
114
-
115
-
116
-
117
-
118
-
119
-
120
-
121
-
122
-
123
-
124
-
125
-
126
-
127
-
128
-
129
-
130
-
131
-
132
-
133
-
134
-
135
-
136
-
137
-
138
-
139
-
140
-
141
-
142
-
143
-
144
-
145
-
146
-
147
-
148
-
149
-
150
-
151
-
152
-
153
-
154
-
155
-
156
-
157
-
158
-
159
-
160
-
161
-
162
 |
 |

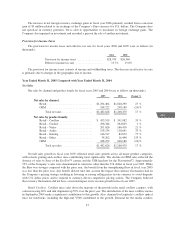
Gross Profit
Gross profit for fiscal years 2005 and 2004 was as follows (in thousands):
2005 2004 Change %
Net sales ................................. $1,482,626 $1,268,470 17%
Cost of goods sold ......................... 979,039 859,548 14%
Grossprofit ............................... $ 503,587 $ 408,922 23%
Grossmargin.............................. 34.0% 32.2%
The increase in gross profit correlated with increased revenues during the same period. The increase in gross
margin primarily reflected a shift in the mix between retail and OEM sales, as well as improved retail gross
margins. As a percentage of total sales, OEM revenues were significantly lower in fiscal year 2005, representing
13% of total sales compared to 20% in the prior year. Overall, retail margins improved in fiscal year 2005
compared with fiscal year 2004. In particular, gross margins for the Company’s video products improved most
significantly, primarily as a result of the Company’s exit from the dualcam category. Gross margin in fiscal year
2005 improved in spite of increases for certain material and fuel costs. During fiscal year 2005, the Company
incurred incremental costs in connection with the introduction and phase-in of a large number of retail products,
which included significant freight costs to expedite delivery of products to meet higher than expected customer
demand.
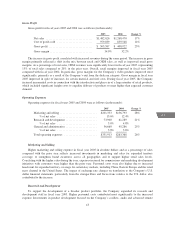
Operating Expenses
Operating expenses for fiscal years 2005 and 2004 were as follows (in thousands):
2005 2004 Change %
Marketing and selling .......................... $201,353 $156,793 28%
% of net sales ............................ 13.6% 12.4%
Research and development ...................... 73,900 61,289 21%
% of net sales ............................ 5.0% 4.8%
General and administrative ...................... 56,660 45,286 25%
% of net sales ............................ 3.8% 3.6%
Total operating expenses ....................... $331,913 $263,368 26%
Marketing and Selling
Higher marketing and selling expense in fiscal year 2005 in absolute dollars and as a percentage of sales
compared with the prior year reflects increased investments in marketing and sales for expanded territory
coverage, to strengthen brand awareness across all geographies and to support higher retail sales levels.
Correlating with the higher sales during the year, expenses incurred for commissions and marketing development
initiatives with customers were higher than the prior year. Personnel costs were also higher due to increased
headcount for expanded territory coverage for certain key markets, including China, Eastern Europe and the retail
mass channel in the United States. The impact of exchange rate changes on translation to the Company’s U.S.
dollar financial statements, particularly from the stronger Euro and Swiss franc relative to the U.S. dollar, also
contributed to the increase.
Research and Development
To support the development of a broader product portfolio, the Company expanded its research and
development staff in fiscal year 2005. Higher personnel costs contributed most significantly to the increased
expense. Investments in product development focused on the Company’s cordless, audio and advanced remote
43
CG
LISA