Logitech 2006 Annual Report Download - page 111
Download and view the complete annual report
Please find page 111 of the 2006 Logitech annual report below. You can navigate through the pages in the report by either clicking on the pages listed below, or by using the keyword search tool below to find specific information within the annual report.-
 1
1 -
2
-
3
-
4
-
5
-
6
-
7
-
8
-
9
-
10
-
11
-
12
-
13
-
14
-
15
-
16
-
17
-
18
-
19
-
20
-
21
-
22
-
23
-
24
-
25
-
26
-
27
-
28
-
29
-
30
-
31
-
32
-
33
-
34
-
35
-
36
-
37
-
38
-
39
-
40
-
41
-
42
-
43
-
44
-
45
-
46
-
47
-
48
-
49
-
50
-
51
-
52
-
53
-
54
-
55
-
56
-
57
-
58
-
59
-
60
-
61
-
62
-
63
-
64
-
65
-
66
-
67
-
68
-
69
-
70
-
71
-
72
-
73
-
74
-
75
-
76
-
77
-
78
-
79
-
80
-
81
-
82
-
83
-
84
-
85
-
86
-
87
-
88
-
89
-
90
-
91
-
92
-
93
-
94
-
95
-
96
-
97
-
98
-
99
-
100
-
 101
101 -
 102
102 -
 103
103 -
 104
104 -
 105
105 -
 106
106 -
 107
107 -
 108
108 -
 109
109 -
 110
110 -
 111
111 -
 112
112 -
 113
113 -
 114
114 -
 115
115 -
 116
116 -
 117
117 -
 118
118 -
 119
119 -
 120
120 -
 121
121 -
122
-
123
-
124
-
125
-
126
-
127
-
128
-
129
-
130
-
131
-
132
-
133
-
134
-
135
-
136
-
137
-
138
-
139
-
140
-
141
-
142
-
143
-
144
-
145
-
146
-
147
-
148
-
149
-
150
-
151
-
152
-
153
-
154
-
155
-
156
-
157
-
158
-
159
-
160
-
161
-
162
 |
 |
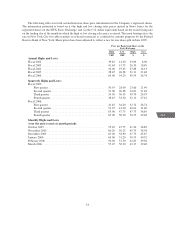
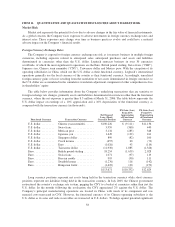
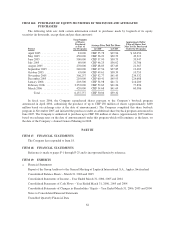
The following table sets forth certain historical share price information for the Company’s registered shares.
The information presented is based on (i) the high and low closing sales prices quoted in Swiss francs for the
registered shares on the SWX Swiss Exchange, and (ii) the U.S. dollar equivalent based on the noon buying rate
on the trading day of the month in which the high or low closing sales price occurred. The noon buying rate is the
rate in New York City for cable transfers in selected currencies as certified for customs purposes by the Federal
Reserve Bank of New York. Share prices have been adjusted to reflect a two for one share split in June 2005.
Price per Registered Share on the
Swiss Exchange
High Low High Low
CHF CHF $ $
Annual Highs and Lows:
Fiscal 2002 ........................................... 39.85 14.50 23.69 8.96
Fiscal 2003 ........................................... 41.63 15.75 26.30 10.49
Fiscal 2004 ........................................... 32.00 19.23 25.88 14.13
Fiscal 2005 ........................................... 38.45 26.38 32.11 21.48
Fiscal 2006 ........................................... 65.00 34.20 50.55 28.74
Quarterly Highs and Lows:
Fiscal 2005:
First quarter ....................................... 30.95 28.00 23.66 21.49
Second quarter ..................................... 31.00 26.38 24.81 21.48
Third quarter ...................................... 34.90 30.33 30.70 24.93
Fourth quarter ..................................... 38.45 32.50 32.11 27.41
Fiscal 2006:
First quarter ....................................... 41.85 34.20 32.72 28.74
Second quarter ..................................... 52.35 41.20 40.61 31.60
Third quarter ...................................... 63.00 47.75 47.73 36.89
Fourth quarter ..................................... 65.00 50.90 50.55 39.48
Monthly Highs and Lows
(over the most recent six month period):
October 2005 .......................................... 53.65 47.75 41.20 36.89
November 2005 ........................................ 60.20 50.25 45.79 38.94
December 2005 ........................................ 63.00 58.90 47.73 45.67
January 2006 .......................................... 65.00 51.20 50.55 40.52
February 2006 ......................................... 56.00 51.30 42.81 39.36
March 2006 ........................................... 55.25 50.90 42.37 39.48
53
CG
LISA