Logitech 2006 Annual Report Download - page 97
Download and view the complete annual report
Please find page 97 of the 2006 Logitech annual report below. You can navigate through the pages in the report by either clicking on the pages listed below, or by using the keyword search tool below to find specific information within the annual report.-
 1
1 -
2
-
3
-
4
-
5
-
6
-
7
-
8
-
9
-
10
-
11
-
12
-
13
-
14
-
15
-
16
-
17
-
18
-
19
-
20
-
21
-
22
-
23
-
24
-
25
-
26
-
27
-
28
-
29
-
30
-
31
-
32
-
33
-
34
-
35
-
36
-
37
-
38
-
39
-
40
-
41
-
42
-
43
-
44
-
45
-
46
-
47
-
48
-
49
-
50
-
51
-
52
-
53
-
54
-
55
-
56
-
57
-
58
-
59
-
60
-
61
-
62
-
63
-
64
-
65
-
66
-
67
-
68
-
69
-
70
-
71
-
72
-
73
-
74
-
75
-
76
-
77
-
78
-
79
-
80
-
81
-
82
-
83
-
84
-
85
-
86
-
 87
87 -
 88
88 -
 89
89 -
 90
90 -
 91
91 -
 92
92 -
 93
93 -
 94
94 -
 95
95 -
 96
96 -
 97
97 -
 98
98 -
 99
99 -
 100
100 -
 101
101 -
 102
102 -
 103
103 -
 104
104 -
 105
105 -
 106
106 -
 107
107 -
108
-
109
-
110
-
111
-
112
-
113
-
114
-
115
-
116
-
117
-
118
-
119
-
120
-
121
-
122
-
123
-
124
-
125
-
126
-
127
-
128
-
129
-
130
-
131
-
132
-
133
-
134
-
135
-
136
-
137
-
138
-
139
-
140
-
141
-
142
-
143
-
144
-
145
-
146
-
147
-
148
-
149
-
150
-
151
-
152
-
153
-
154
-
155
-
156
-
157
-
158
-
159
-
160
-
161
-
162
 |
 |
OEM. OEM revenues increased 11% compared with fiscal year 2005 and represented 12% of total sales in
fiscal year 2006, the same proportion as last year. OEM units increased 16%, mainly driven by strong growth in
corded mice sales to PC manufacturers, supported by increased OEM sales of gaming products. The timing and
size of the opportunities for Logitech’s OEM gaming products are difficult to predict, as they are sensitive to
trends in these industries, including customer preferences, the popularity and nature of games introduced, and the
products with which our products may be bundled.
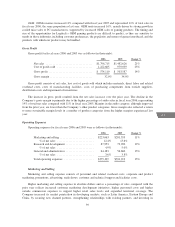
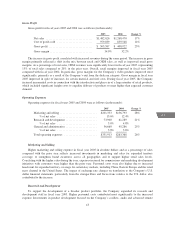
Gross Profit
Gross profit for fiscal years 2006 and 2005 was as follows (in thousands):
2006 2005 Change %
Net sales ................................. $1,796,715 $1,482,626 21%
Cost of goods sold ......................... 1,222,605 979,039 25%
Grossprofit ............................... $ 574,110 $ 503,587 14%
Grossmargin.............................. 32.0% 34.0%
Gross profit consists of net sales, less cost of goods sold which includes materials, direct labor and related
overhead costs, costs of manufacturing facilities, costs of purchasing components from outside suppliers,
distribution costs and impairment of inventories.
The increase in gross profit resulted from the net sales increase over the prior year. The decline in the
Company’s gross margin is primarily due to the higher percentage of audio sales in fiscal year 2006, representing
19% of total net sales compared with 11% in fiscal year 2005. Margins in the audio category, although improved
from the prior year, are lower than the Company’s other product categories. Gross margin also reflected a return
to more sustainable margin levels in a number of product categories from the higher margins experienced last
year.
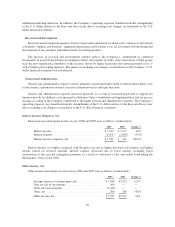
Operating Expenses
Operating expenses for fiscal years 2006 and 2005 were as follows (in thousands):
2006 2005 Change %
Marketing and selling ........................ $223,063 $201,353 11%
% of net sales .......................... 12.4% 13.6%
Research and development .................... 87,953 73,900 19%
% of net sales .......................... 4.9% 5.0%
General and administrative .................... 64,183 56,660 13%
% of net sales .......................... 3.6% 3.8%
Total operating expenses ..................... $375,199 $331,913 13%
Marketing and Selling
Marketing and selling expense consists of personnel and related overhead costs, corporate and product
marketing, promotions, advertising, trade shows, customer and technical support and facilities costs.
Higher marketing and selling expense in absolute dollars and as a percentage of sales compared with the
prior year reflects increased customer marketing development initiatives, higher personnel costs and higher
outside commission expenses to support higher retail sales levels and expanded territorial coverage. The
Company increased its market penetration in developing markets, such as Latin America, Eastern Europe and
China, by securing new channel partners, strengthening relationships with existing partners, and investing in
39
CG
LISA