Logitech 2006 Annual Report Download - page 148
Download and view the complete annual report
Please find page 148 of the 2006 Logitech annual report below. You can navigate through the pages in the report by either clicking on the pages listed below, or by using the keyword search tool below to find specific information within the annual report.-
 1
1 -
2
-
3
-
4
-
5
-
6
-
7
-
8
-
9
-
10
-
11
-
12
-
13
-
14
-
15
-
16
-
17
-
18
-
19
-
20
-
21
-
22
-
23
-
24
-
25
-
26
-
27
-
28
-
29
-
30
-
31
-
32
-
33
-
34
-
35
-
36
-
37
-
38
-
39
-
40
-
41
-
42
-
43
-
44
-
45
-
46
-
47
-
48
-
49
-
50
-
51
-
52
-
53
-
54
-
55
-
56
-
57
-
58
-
59
-
60
-
61
-
62
-
63
-
64
-
65
-
66
-
67
-
68
-
69
-
70
-
71
-
72
-
73
-
74
-
75
-
76
-
77
-
78
-
79
-
80
-
81
-
82
-
83
-
84
-
85
-
86
-
87
-
88
-
89
-
90
-
91
-
92
-
93
-
94
-
95
-
96
-
97
-
98
-
99
-
100
-
101
-
102
-
103
-
104
-
105
-
106
-
107
-
108
-
109
-
110
-
111
-
112
-
113
-
114
-
115
-
116
-
117
-
118
-
119
-
120
-
121
-
122
-
123
-
124
-
125
-
126
-
127
-
128
-
129
-
130
-
131
-
132
-
133
-
134
-
135
-
136
-
137
-
 138
138 -
 139
139 -
 140
140 -
 141
141 -
 142
142 -
 143
143 -
 144
144 -
 145
145 -
 146
146 -
 147
147 -
 148
148 -
 149
149 -
 150
150 -
 151
151 -
 152
152 -
 153
153 -
 154
154 -
 155
155 -
 156
156 -
 157
157 -
 158
158 -
159
-
160
-
161
-
162
 |
 |

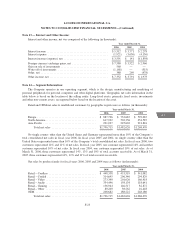
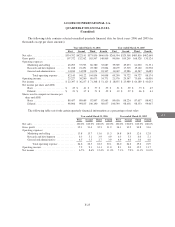
LOGITECH INTERNATIONAL S.A.
QUARTERLY FINANCIAL DATA
(Unaudited)
The following table contains selected unaudited quarterly financial data for fiscal years 2006 and 2005 (in
thousands except per share amounts):
Year ended March 31, 2006 Year ended March 31, 2005
First Second Third Fourth First Second Third Fourth
Net sales ......................... $334,702 $422,101 $573,856 $466,056 $266,594 $329,568 $483,816 $402,648
Gross profit ...................... 107,372 132,362 185,507 148,869 90,866 109,269 168,328 135,124
Operating expenses:
Marketing and selling .......... 46,293 57,703 66,380 52,687 39,569 49,233 61,020 51,531
Research and development ...... 21,018 21,491 22,380 23,064 16,679 17,503 19,160 20,558
General and administrative ...... 14,834 14,928 16,074 18,347 13,042 12,986 14,547 16,085
Total operating expense ..... 82,145 94,122 104,834 94,098 69,290 79,722 94,727 88,174
Operating income .................. 25,227 38,240 80,673 54,771 21,576 29,547 73,601 46,950
Net income ....................... $ 22,397 $ 36,237 $ 71,348 $ 51,123 $ 18,855 $ 25,989 $ 64,189 $ 40,233
Net income per share and ADS:
Basic ........................ $ .25 $ .41 $ .77 $ .55 $ .21 $ .29 $ .73 $ .45
Diluted ...................... $ .23 $ .37 $ .71 $ .52 $ .19 $ .27 $ .66 $ .41
Shares used to compute net income per
share and ADS:
Basic ........................ 88,457 88,689 92,897 92,683 89,656 88,224 87,657 88,452
Diluted ...................... 98,906 99,835 100,190 98,057 100,590 98,438 98,353 99,067
The following table sets forth certain quarterly financial information as a percentage of net sales:
Year ended March 31, 2006 Year ended March 31, 2005
First Second Third Fourth First Second Third Fourth
Net sales ................................. 100.0% 100.0% 100.0% 100.0% 100.0% 100.0% 100.0% 100.0%
Gross profit .............................. 32.1 31.4 32.3 31.9 34.1 33.2 34.8 33.6
Operating expenses:
Marketing and selling .................. 13.8 13.7 11.6 11.3 14.8 14.9 12.6 12.8
Research and development .............. 6.3 5.1 3.9 4.9 6.3 5.3 4.0 5.1
General and administrative .............. 4.5 3.5 2.7 3.9 4.9 4.0 3.0 4.0
Total operating expense ............. 24.6 22.3 18.2 20.1 26.0 24.2 19.6 21.9
Operating income .......................... 7.5 9.1 14.1 11.8 8.1 9.0 15.2 11.7
Net income ............................... 6.7% 8.6% 12.4% 11.0% 7.1% 7.9% 13.3% 10.0%
F-25
CG
LISA