Food Lion 2009 Annual Report Download - page 78
Download and view the complete annual report
Please find page 78 of the 2009 Food Lion annual report below. You can navigate through the pages in the report by either clicking on the pages listed below, or by using the keyword search tool below to find specific information within the annual report.-
 1
1 -
2
-
3
-
4
-
5
-
6
-
7
-
8
-
9
-
10
-
11
-
12
-
13
-
14
-
15
-
16
-
17
-
18
-
19
-
20
-
21
-
22
-
23
-
24
-
25
-
26
-
27
-
28
-
29
-
30
-
31
-
32
-
33
-
34
-
35
-
36
-
37
-
38
-
39
-
40
-
41
-
42
-
43
-
44
-
45
-
46
-
47
-
48
-
49
-
50
-
51
-
52
-
53
-
54
-
55
-
56
-
57
-
58
-
59
-
60
-
61
-
62
-
63
-
64
-
65
-
66
-
67
-
 68
68 -
 69
69 -
 70
70 -
 71
71 -
 72
72 -
 73
73 -
 74
74 -
 75
75 -
 76
76 -
 77
77 -
 78
78 -
 79
79 -
 80
80 -
 81
81 -
 82
82 -
 83
83 -
 84
84 -
 85
85 -
 86
86 -
 87
87 -
 88
88 -
89
-
90
-
91
-
92
-
93
-
94
-
95
-
96
-
97
-
98
-
99
-
100
-
101
-
102
-
103
-
104
-
105
-
106
-
107
-
108
-
109
-
110
-
111
-
112
-
113
-
114
-
115
-
116
-
117
-
118
-
119
-
120
-
121
-
122
-
123
-
124
-
125
-
126
-
127
-
128
-
129
-
130
-
131
-
132
-
133
-
134
-
135
-
136
-
137
-
138
-
139
-
140
-
141
-
142
-
143
-
144
-
145
-
146
-
147
-
148
-
149
-
150
-
151
-
152
-
153
-
154
-
155
-
156
-
157
-
158
-
159
-
160
-
161
-
162
-
163
 |
 |

74 - Delhaize Group - Annual Report 2009
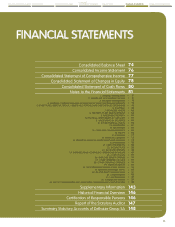
CONSOLIDATED STATEMENT
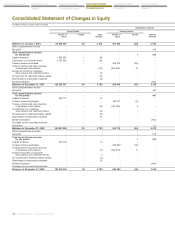
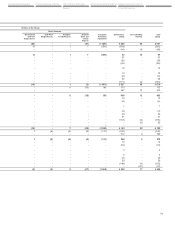
OF CHANGES IN EQUITY
CONSOLIDATED STATEMENT
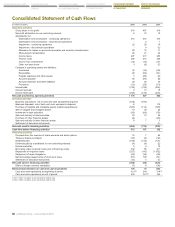
OF CASH FLOWS
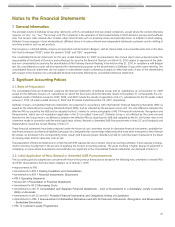
NOTES TO THE FINANCIAL
STATEMENTS
CONSOLIDATED STATEMENT
OF COMPREHENSIVE INCOME
CONSOLIDATED INCOME
STATEMENT
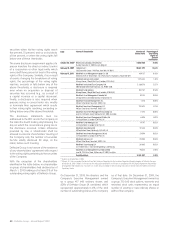
CONSOLIDATED BALANCE SHEET
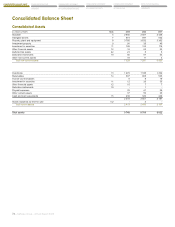
Consolidated Balance Sheet
Consolidated Assets
(in millions of EUR) Note 2009 2008 2007
Goodwill 6 2 640 2 607 2 446
Intangible assets 7 574 597 552
Property, plant and equipment 8 3 785 3 832 3 383
Investment property 9 50 39 40
Investment in securities 11 126 123 116
Other financial assets 12 16 23 25
Deferred tax assets 22 23 8 6
Derivative instruments 19 96 57 53
Other non-current assets 19 11 4
Total non-current assets 7 329 7 297 6 625
Inventories 13 1 278 1 338 1 262
Receivables 14 597 608 565
Income tax receivables 8 8 19
Investment in securities 11 12 28 36
Other financial assets 12 15 7 7
Derivative instruments 19 - 1 -
Prepaid expenses 33 41 29
Other current assets 37 50 30
Cash and cash equivalents 15 439 320 249
2 419 2 401 2 197
Assets classified as held for sale 5.2 - 2 -
Total current assets 2 419 2 403 2 197
Total assets 9 748 9 700 8 822